An honest comparison of the best APM and monitoring tools for small teams (2-20 engineers) without dedicated DevOps or SRE. Covers Scout Monitoring, AppSignal, Honeybadger, Sentry, New Relic, and Datadog.
An honest comparison of the best APM tools for Node.js in 2026. Covers Scout Monitoring, Datadog, New Relic, AppSignal, Dynatrace, and PM2 Plus for Express and NestJS teams.
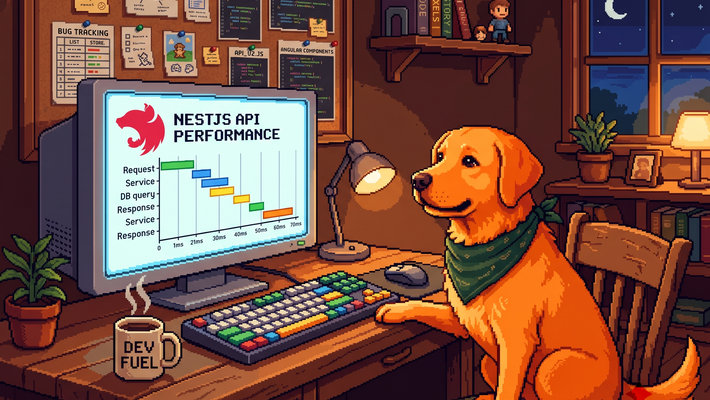
A practical guide to monitoring NestJS applications in production. Covers what to instrument, what to ignore, and how to find the problems that only show up under real traffic.
How N+1 queries happen in Prisma, why they are hard to catch in development, and how Scout automatically detects them in production Node.js applications.
A practical comparison of APM tools for small development teams without dedicated DevOps or SRE. Covers Scout, Sentry, Honeybadger, AppSignal, New Relic, and Datadog.
Looking for a Sentry alternative? A practical comparison of tools that offer more integrated APM, simpler pricing, or better fit for specific languages and team sizes.
How to find, fix, and prevent N+1 queries in Elixir applications using Ecto. Covers Repo.preload, inline preloads, Oban jobs, Phoenix LiveView patterns, and automatic detection with Scout.
How to find, fix, and prevent N+1 queries in Rails applications. Covers ActiveRecord includes, preload, eager_load, the Bullet gem, Sidekiq jobs, and automatic detection with Scout.
Application performance monitoring gives engineering teams visibility into how their software behaves in production. Here is what APM is, what it measures, and how modern teams use it to go from alert to fix.
Scout and Sentry both handle error monitoring and performance, but they started from different places, which shapes what each does well. If you are evaluating both, the origin story is worth understanding because it explains most of the differences you will run into.
Regular monitoring practices can emphasize application response time, but queue time is also often an early and important warning sign. If it rises, you’ll quickly see downstream effects: tail latency, timeouts, and error spikes. This means that this metric can give you a head start tackling app issues before they become user problems. In this post, we’ll discuss queue time, how things can go off track, and practical steps to turn it around.
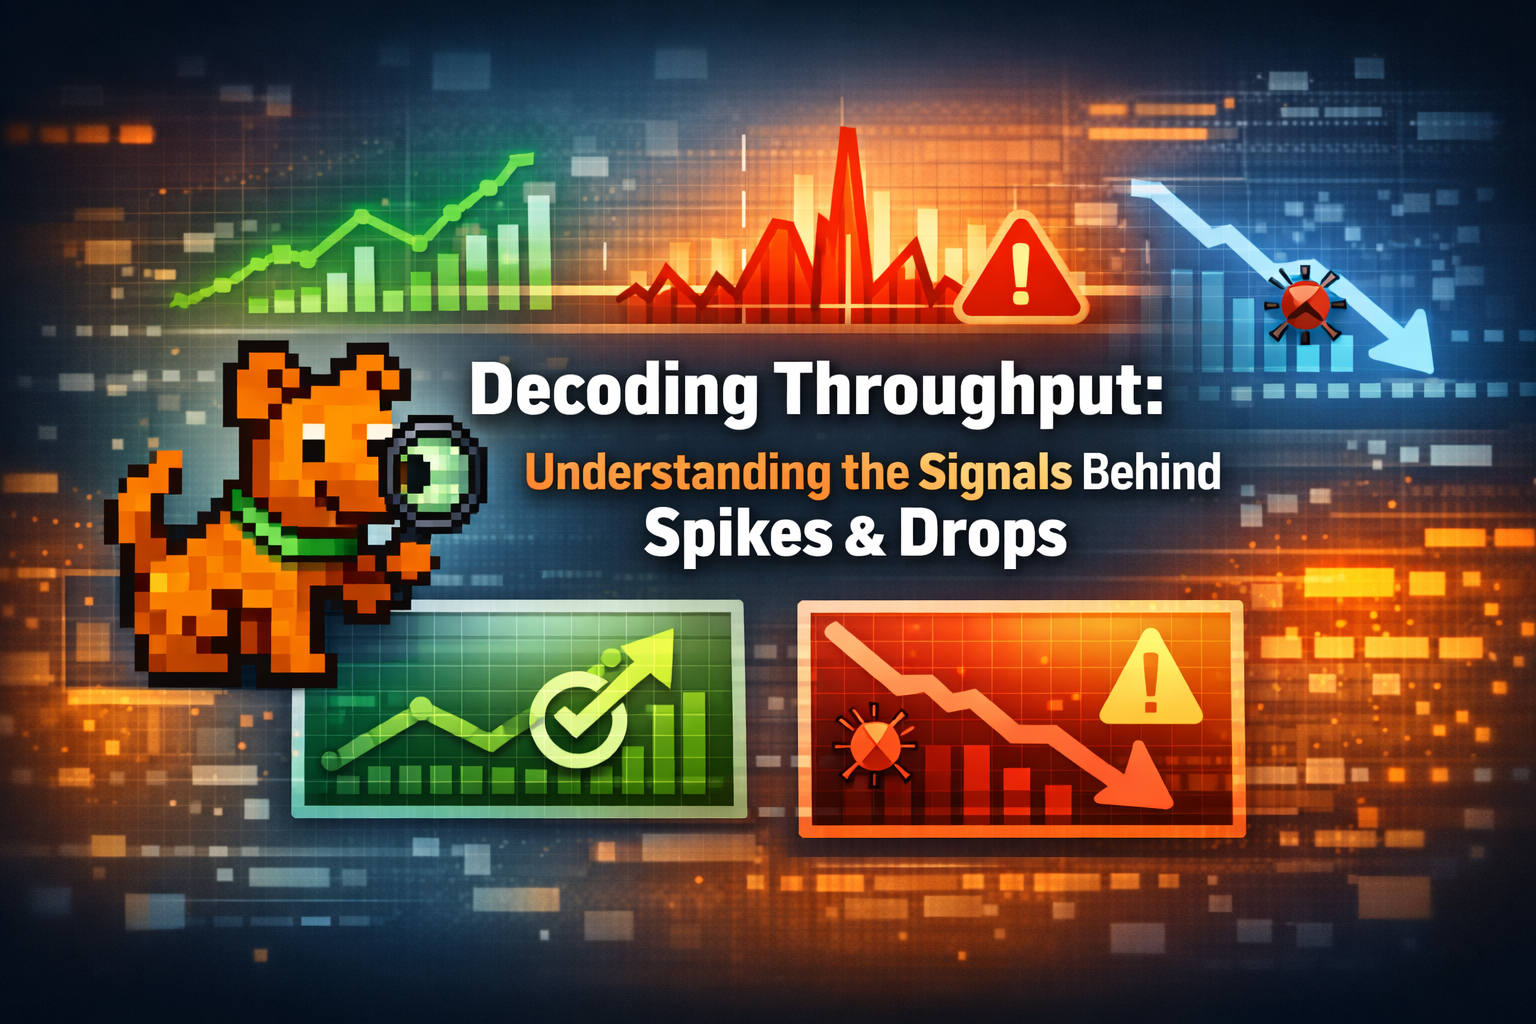
Throughput is a powerful performance metric, but it is essentially meaningless in isolation. Once correlated with other application data, you start to get to the heart of what is driving performance changes in your application.
Everything looks green and happy on your dashboard, so why are your users upset? Dive into the world of percentiles and how to pull clarity from the metric noise to better understand the health of your application.
AI-native monitoring is designed for teams shipping AI-generated code. It brings errors, metrics, and performance data into your LLM, where you already work. Learn how this new approach helps developers tame black-box AI code, cut tool sprawl, and stay in flow — making apps built with AI-generated code easier to debug, scale, and trust.
As Rails apps scale, slow SQL can start to become an issue. Database logs can help, but don't show the location of the problem code. Read this post for an understanding of where the problems can start, and how Scout can send slowness packing.
Learn how to boost Ruby on Rails app performance and reduce server load in this second part by understanding Rails cache stores: their configuration and memory stores.
What N+1 queries are, why they slow down your application, and how to detect and fix them in Rails, Django, and Elixir. Includes code examples, detection tools, and monitoring strategies.
Discover how Web Assembly (WASM) revolutionizes Ruby website performance, optimizing code for unparalleled speed. Explore its transformative impact, ensuring seamless user experiences with advanced optimization techniques.Discover how Web Assembly (WASM) revolutionizes Ruby website performance, optimizing code for unparalleled speed. Explore its transformative impact, ensuring seamless user experiences with advanced optimization techniques.
Discover the hidden culprit slowing down your apps: Cold starts. Learn how to optimize performance and enhance user experience by tackling these delays head-on.
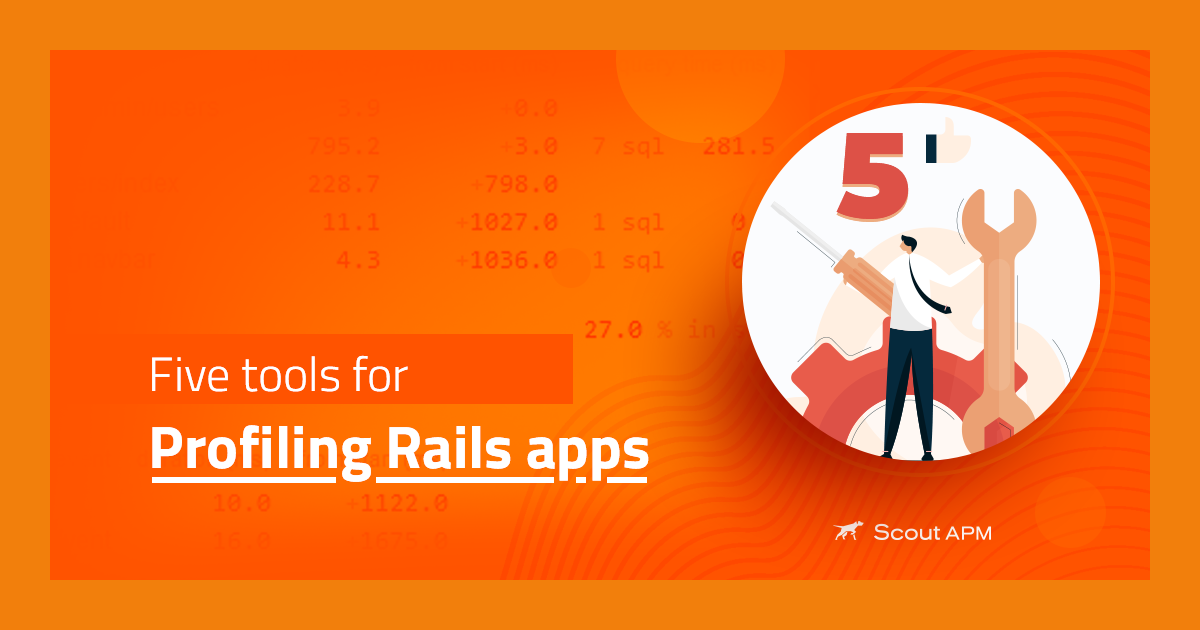
Finding profilers that reliably work proves to be a bigger challenge than most devs think. Here's a summary of the Rails profiler ecosystem: what works, what doesn't, and each profiler's niche.
Explore Scout's new mTLS feature for webhook alerting, offering enhanced security through double ID checks and encrypted messaging. Learn about the 'what' and 'why' of mTLS implementation
Discover unparalleled performance monitoring for Django with Scout APM. Empower your development team with real-time insights, custom transaction monitoring, error tracking, and seamless GitHub integration, ensuring optimal application performance and a seamless user experience
Experience peace of mind with our recent achievement: SOC 2 certification. Our unwavering dedication to ensuring the health of your systems and the protection of your customers is now officially recognized. Trust in our commitment to security and join us in celebrating this significant milestone in our journey together.
This post provides a guide to configure the OpenTelemetry gems in a Ruby on Rails application. It highlights the significance of OpenTelemetry in the Observability space and the need for precise configuration for optimal performance.
Get to the heart of your performance problems quickly with Application Performance Management (APM). Choosing between New Relic and Scout can be a complex decision. In this article, we explore the pros and cons of New Relic and Scout APM.
Discover the power of lambdas in Ruby with our comprehensive guide. Learn how to effectively use lambdas, the difference between lambdas and Procs, and their performance profiles. Take your Ruby programming skills to the next level.
According to Google, the application or page with less response time ranks higher in their search engine. Other factors work simultaneously for ranking, but response time is important. Every...
Observability, as the name implies, helps in observing the performance of the application. Observability provides context and actionable insight by merging four forms of observability data: metrics,...
As more and more organizations adopt cloud-native technologies, the need to align business objectives and end-user experience with IT infrastructure's availability and performance is ever-growing....
After the global pandemic and lockdowns, most businesses look onward to online solutions for their applications. They want to take their business online by creating mobile or web applications....
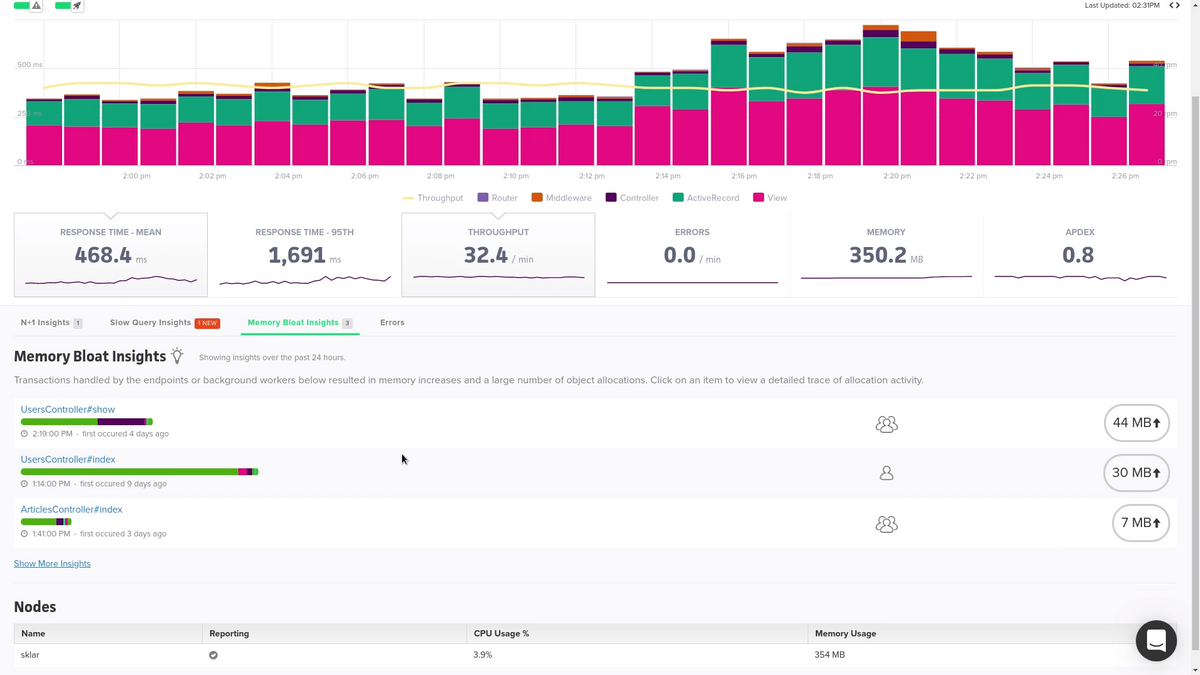
How to Identify and Debug Memory Bloat Even the systems that run smoothly day and night, can flounder when short of memory. Efficient memory usage has become of utmost importance for software...
You might have heard the analogy of pets vs cattle in a cloud-native context, the idea is that the old way of maintaining indispensable servers was the pet way of doing things, whereas moving towards...
We are living in a time where a difference of a mere couple of seconds can make you lose your business to another company with a faster, more easily accessible web application. In such a highly...
With the increase in demand for technology and quality assurance, companies are looking to improve their products day by day. For many, time and workforce are limited, so companies are interested in...
There are a lot of important components needed to run a successful web application. The language you code it in, which developers are working on the project, and the integrations with other services...
Application Performance Monitoring has been a popular concept among developers and companies alike. APM data has helped product teams increase their growth and revenue manifold. Whether it is an...
Learn how to improve performance and ROI with modern APM technology. Discover the latest tricks in Application Performance Monitoring in this informative article.
Integrated APM system is a must-have tool for monitoring and controlling your operating costs. With real-time visibility and actionable insights, you can improve performance, increase efficiency and reduce costs, stay ahead of competition and make better decision for your business.
Are you using multiple APM tools to monitor your applications? If so, you may be wasting resources. In this blog post, we’ll show you how to consolidate your APM tools saving you time and money.
You can monitor the performance of your web applications using Scout APM. This dashboard lets you see how your app is performing and identify areas for improvement.
The sooner you can see how your latest code is performing, the faster you can optimize it. APM metrics can help you with visibility in your application development process.
What are the most important database performance metrics, and how do you monitor them? This is a question many IT professionals would like the answer to. We can collect and use a wide range of...
The most powerful language is python. It offers every attribute an object-oriented programming language has to offer. Let's evaluate how Scout stacks up against New Relic.
Services Oriented Architecture (SOA) is a style of software design where services are provided to the other components by application components, through a communication protocol over a network. The basic principles of SOA
When it comes to web development, downtime is not an option. If your site goes down, it's not just costing you potential customers - it's costing your team money. Read about how to reduce these costs.
Since buying an APM tool is not something that you'd do routinely, you should pay extra attention to do everything that can guide you in choosing the best tool for your use case.
Django is a popular high-level web development framework built on top of Python known for high-speed development and has a more straightforward learning curve than other web frameworks. Learn more about Django monitoring!
Monitoring your Flask application can be a challenge. Luckily, there are many companies that provide Flask monitoring services. In this blog we go through the advantages of utilizing Flask, as well as how to use APM to monitor a flask application.
This article will disucss web endpoints, how they broadly operate, the importance of monitoring them, and how you can get started with endpoint monitoring for your own application using effective APM tools
APM provides a helpful bird's eye view of your application and the status of the operations taking place within. Learn more about the ROI of having an APM tool.
OpenTelemetry is a free and open-source software initiative with the objective of supplying software developers with the means to create distributed systems. Check out this guide to all things Otel!
Open Source APM Tools are types of software whose source code is publicly accessible. Learn about open source APM and the difference between traditional APM tools
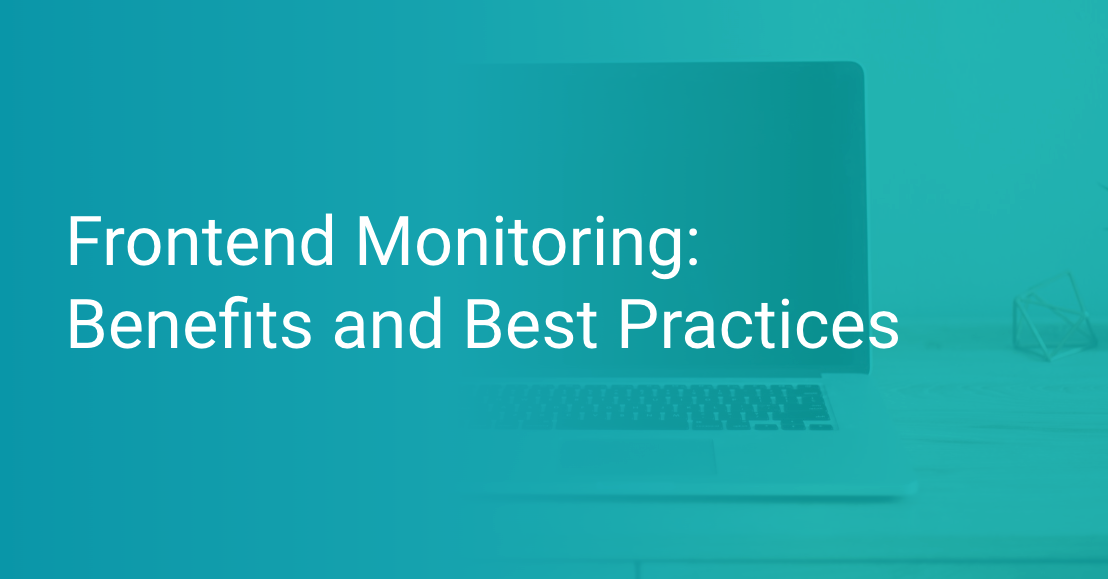
Frontend monitoring is a process of tracking and maintaining the health of an application’s client-side. It involves monitoring the availability, functionality, and performance of the client-side of an application. Learn more!
The OpenTelemetry collector is optional when using a SaaS service like Scout. Even so, knowing what the Collector can do and when to use it is helpful to understand. Click to learn more!
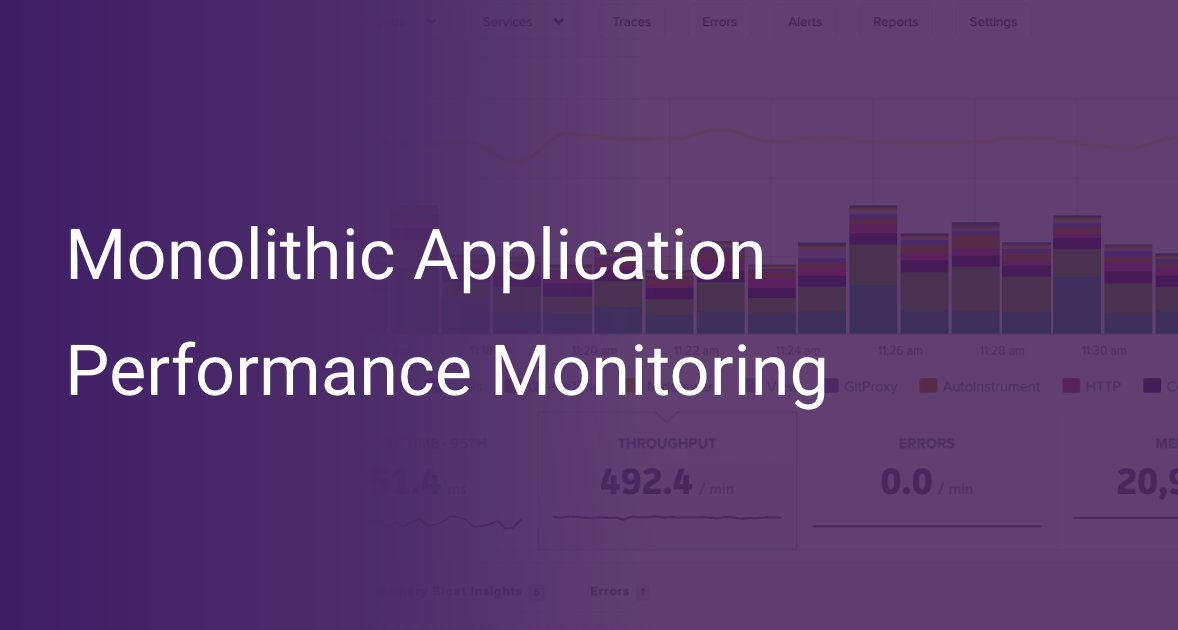
Monitoring monolithic architecture is challenging as you cannot see each part of the architecture separately. Read more to learn how to monitor monolithic architecture successfully!
Python performance measurement tools help us to identify performance bottlenecks in our app. This allows us to focus on the business login as opposed to writing custom code, setting it up with our app, and then figuring out whether the results are accurate enough. These tools are well tested by the open source community and used by many companies to measure the performance of their web apps.
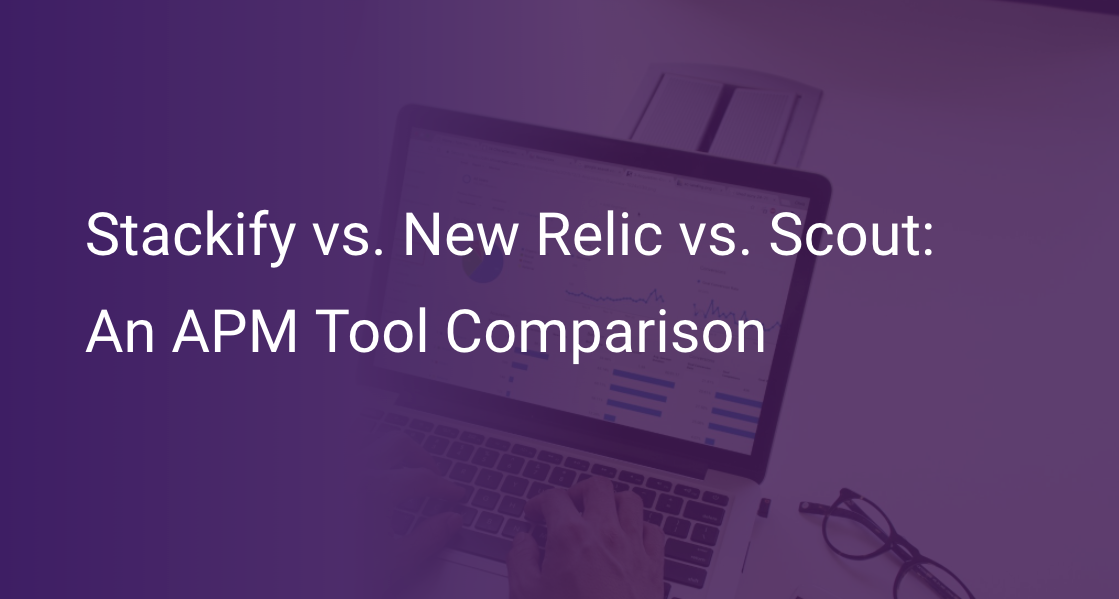
There are a lot of monitoring tools on the market to choose from, but how do you know which one is right for your business? Check out this comparison of 3 top tools on the market: Stackify, New Relic and Scout.
New Relic and Appdynamics were the two most dominating APMs in the software industry some years back. But due to some lack of functionalities, customers have begun switching to different tools because now they have a perfect solution for their particular use case. Read more about how Scout compares to some top competitors!
You need to choose the perfect monitoring solution that gives you complete visibility over your application’s aspects. To help you in your hunt, we have compared three popular monitoring platforms in this article—Splunk, Dynatrace, and Scout.
An APM tool is essential for a successful application. Check out this comparison of three top tools in the market so you choose the right one for your business!
Finding and fixing errors and performance issues can take valuable time away from the development team, preventing them from being able to build new features for their applications.
A significant portion of application performance monitoring involves monitoring database performance to ensure that our SQL queries are as efficient as possible. Scout features a Database Monitoring page with this in mind, and in this post, we are going to take a closer look at what it has to offer.
The N+1 Queries Problem is a perennial database performance issue. It affects many ORM’s and custom SQL code, and Django’s ORM is not immune either. In this post, we’ll examine what the N+1 Queries Problem looks like in Django, some tools for fixing it, and most importantly some tools for ...
In this video, we are going to take a look at what memory bloat is, and how you can use Scout to eliminate it from your applications. Which transactions are responsible, and what caused it?
If you are using Ruby on Rails, caching might be one of the best tools on your belt to build a better application. The idea behind caching in Rails is to serve thousands of concurrent users on a single server with a single database attached. Let’s take a look at some of the benefits caching can provide.
Last month we talked about the PHP monitoring landscape in 2019 and announced that Scout APM would soon be available for monitoring your Laravel applications too (as well as your Ruby, Python and Elixir apps of course!). Now that our PHP monitoring agent is ready for beta testing, we thought it would be a good idea to show you folks how easy it is to get started with it and to highlight the main features to the Laravel community.
One of the joys of using the Ruby language is the many different ways that you can solve the same problem, it’s a very expressive language with a rich set of libraries. But how do we know which is the best, most efficient, use of the language? When we are talking about algorithms which are critical to the performance of your application, understanding the most efficient approach to take is essential. Perhaps you’ve been using Scout to hunt down issues, and now that you have found an issue, you want to optimize it. Ruby’s Benchmark module provides a very handy way for you to compare and contrast possible optimizations, and when used in conjunction with a good APM solution it will ensure that you have all bases covered. Let’s take a look at how you can get started with it today!
There is no denying the popularity of PHP. It has been a constant force in the web development world since its release way back in 1995. And now in 2019, thanks to Laravel, it is still going as strong as ever! Here at Scout, recently we have been working hard on providing a PHP performance monitoring agent to sit alongside our existing ruby, python and elixir agents. Prior to us releasing this PHP agent, let’s take a look at the PHP ecosystem to see how Scout can complement the existing monitoring landscape.
I'm an engineer by trade. I rely on intuition when investigating a slow Django app. I've solved a lot of performance issues over the years and the short cuts my brain takes often work. However, intuition can fail. It can fail hard in complex Django apps with many layers (ex: ...
Forecasting traffic to your web app is important for capacity planning, but generating a seasonally accurate model of your traffic is pretty daunting. If you under-forecast: Your app servers may become oversaturated, and requests will start backing up in a queue. If you over-forecast you may end up overspending.
It was a great night of chatting, coding, and application performance monitoring in Tokyo. Thanks to everyone who came out to hear our very own Naohiro present about Fast JSON:API. How does Fast JSON:API compare to other Active Model Serializers? Naohiro showed us how he switched from Jbuilder to Fast ...
In this post, I'll show how to setup Scout to monitor the performance of SQL queries, external HTTP calls, template rendering, and more in Wagtail , a Django CMS app. Wagtail is a fast, modern...
I don't know of an easier way to deploy a Django app than letting Heroku do the work. That said, how do you stay on top of your app's performance, errors, and stability post-launch? Running an app on Heroku is a blissful experience, but it presents some monitoring challenges that ...
This post covers instrumenting a Django app with StatsD. StatsD is logging for metrics and is the missing swiss army knife in your measurement toolbelt.
The Django ORM makes it easy to fetch data, but there's a downside: it's easy to write inefficient queries as the number of records in your database grows.
Browser development tools - like Chrome Dev Tools - are vital for debugging client-side performance issues. However, server-side performance metrics have been outside the browser's reach. That changes with the Server Timing API . Supported by Chrome 65+, Firefox 59+, and more browsers, the Server Timing API defines a spec ...
Observability: the degree to which you can ask new questions of your system without having to ship new code or gather new data. Above is my slightly modified definition of observability, mostly stolen from Charity Majors in Observability: A Manifesto . Observability is increasingly important . Modern apps and services ...
The New Relic price tag goes up dramatically as your server footprint grows. This might not be an issue if you are utilizing New Relic's full product suite, but what if you just care about error and performance monitoring? In that case, there's a solution that offers richer features as ...
Most of a web page's load time is on the front-end. You can monitor the performance of the end-to-end page load time with a Real User Monitoring (RUM) service, and one of the more attractive ones is Raygun Pulse . Let's take a deep dive. Installing Raygun Pulse Installing Pulse ...
You're probably confused where DataDog and Scout overlap. You're not alone! They've each offered similar products since their inception, and come on, they both have dogs in their logos! Here's a timeline to clear things up: Both Scout (2009) and DataDog (2010) started around the same time and focused on ...
A database is a shared resource for a Rails application. A single misbehaving query hitting your database can slow down unrelated queries throughout your system. When we began running our own database monitoring against our apps, we discovered several expensive queries that weren't apparent when viewing individual web endpoints and ...
Are folks upgrading to Rails 5? Where is the Postgres vs. MySQL battle heading? Are devs embracing Puma and concurrency? If you're curious about the above, you've come to the right place. We collect...
DevTrace is a performance widget for your Rails applications in development. It sits unobtrusively in the corner of your page, just waiting to drop insight on your application: See stack traces, SQL timings, and more with just a click! This kind of insight is powerful. You can see how your ...
When your app is experiencing memory bloat - a sharp increase in memory usage due to the allocation of many objects - it's a particularly stressful firefight. Slow performance is one thing....
Donald Knuth wrote an often quoted paper in the 70s which is still referenced when talking about performance in web apps today. Premature optimization is the root of all evil. In my line of work, it...
Teaser for a soon-to-be released capability: Overview metrics for all your background jobs Chart throughput, latency, error rate, and more. Detailed drill-down on slow jobs See what's making the job slow, identify N+1 queries, and more. Tech preview - want in? Background job monitoring currently supports sidekiq, and is tech ...
High monitoring overhead is a silent killer : your app's requests take longer, throughput capacity shrinks, end users requests start stacking up in a request queue, you react by provisioning more...
Tracking down slow code is about to get a lot faster. We're excited to debut our Github Integration for Scout Application Monitoring: With the Github Integration enabled, instead of seeing backtraces for slow method calls (>= 500 ms), you'll see the relevant code in our UI. This goes beyond the ...
When it comes to agent-based monitoring and Docker , you're typically choosing between two bad options: (1) install the agent and its dependencies directly on the host or (2) running an agent in...
Your high-powered server is suddenly running dog slow, and you need to remember the troubleshooting steps again. Bookmark this page for a ready reminder the next time you need to diagnose a slow...