Lumen Performance Monitoring
Errors, logs, and traces for your Lumen microservice applications. Scout's PHP agent automatically instruments Lumen controllers, Eloquent queries, and queue workers. Supports PHP 7.2 through 8.3.
Errors, Logs, and Traces in One View for Lumen Apps
Scout connects Lumen exceptions to the full request trace and surrounding log lines in a single view. When a controller throws an exception, you see the error, the trace including Eloquent queries and external HTTP calls, and the surrounding log lines together.
Error Monitoring
Automatic exception capture across Lumen controllers and middleware. Errors are linked to the request trace with full stack traces and request context attached.
Log Management
Log output is enriched with trace context. See what your Lumen application was doing before, during, and after an issue without switching tools.
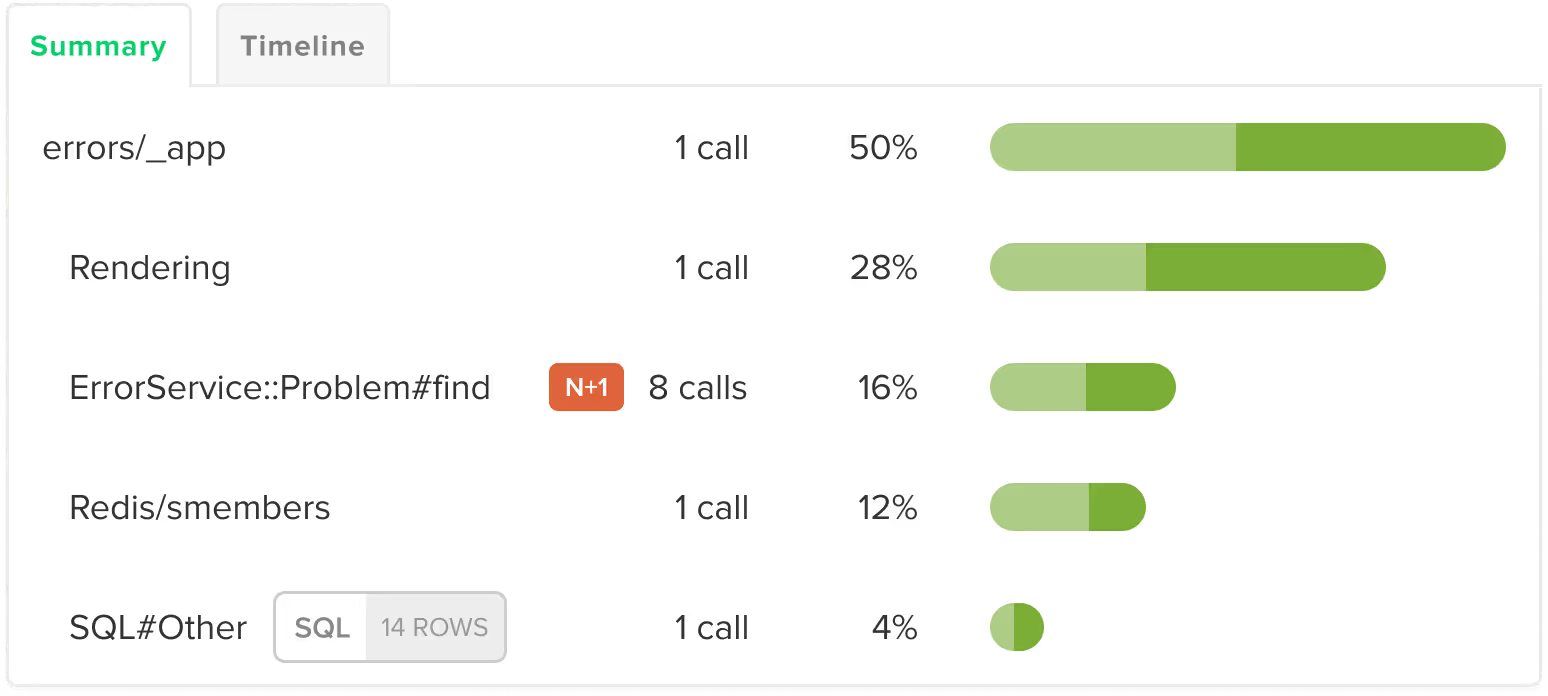
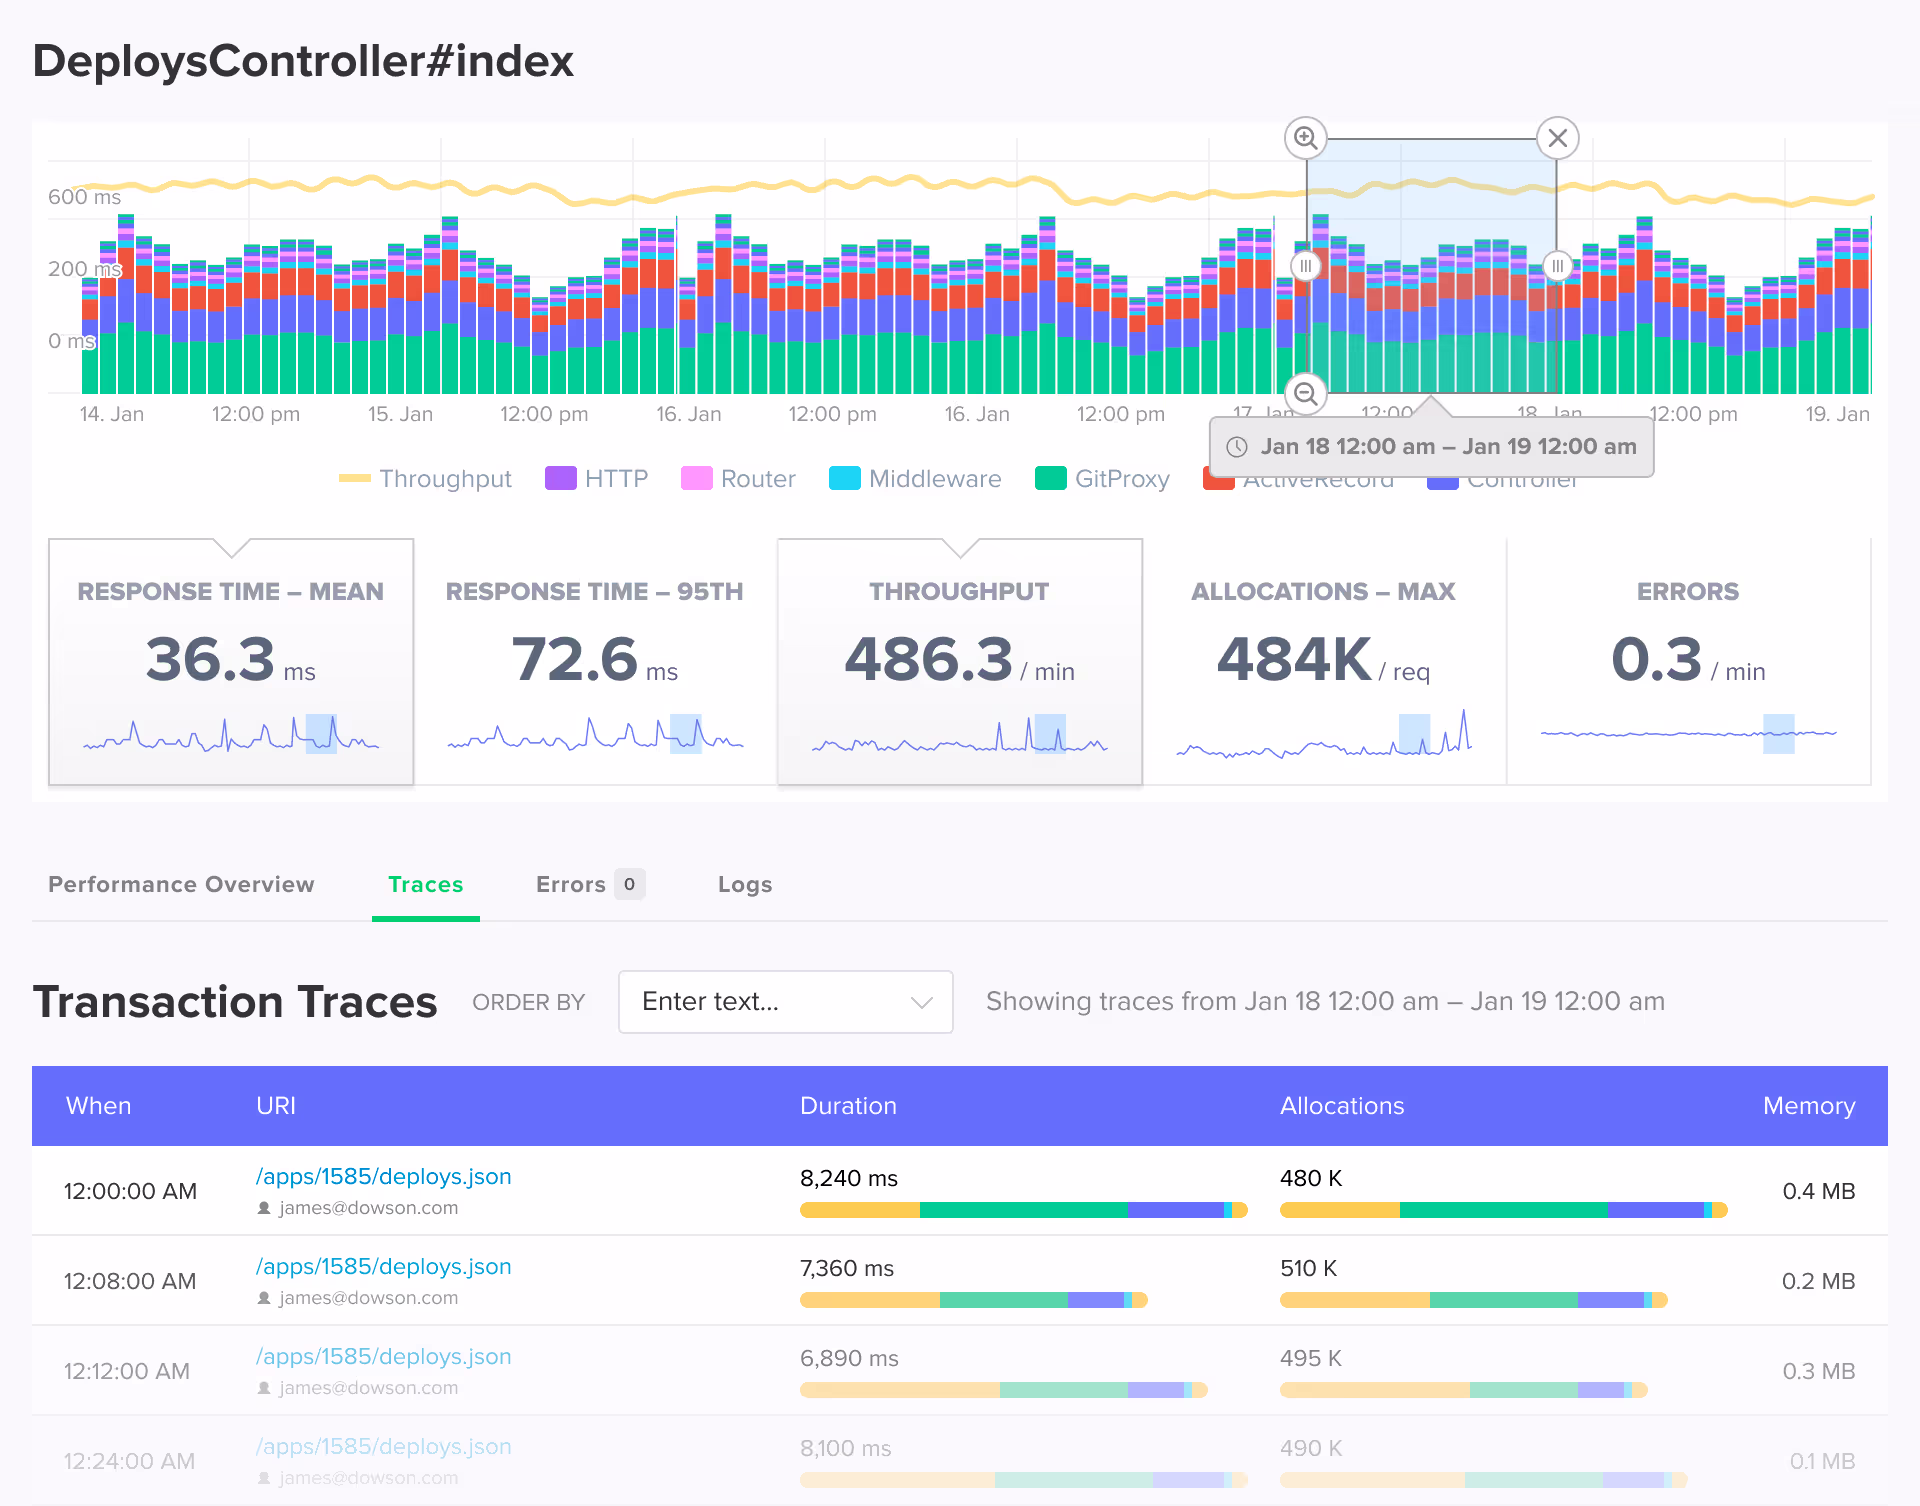
App Traces
Transaction tracing with code-level visibility into Lumen controllers, Eloquent queries, and external HTTP calls. Detailed backtraces show the exact line of code responsible for slow API responses.
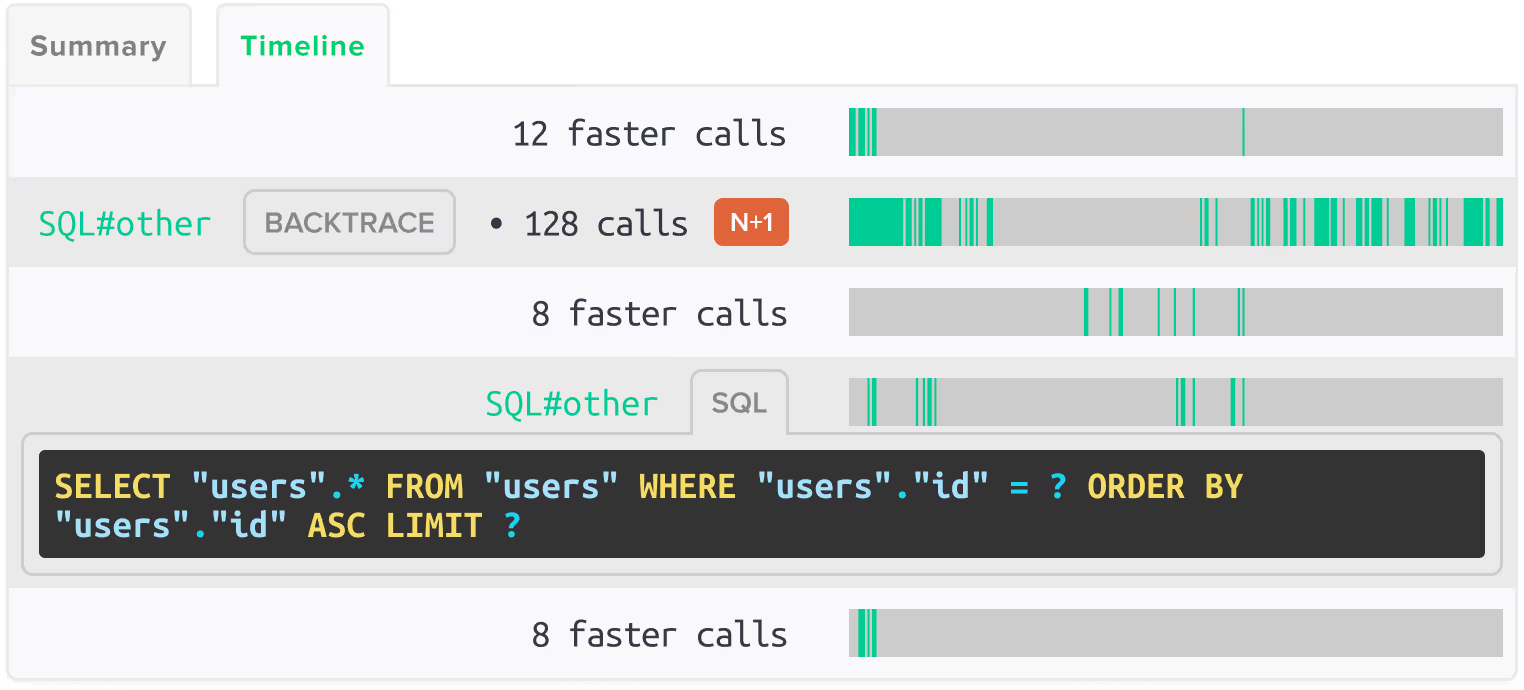
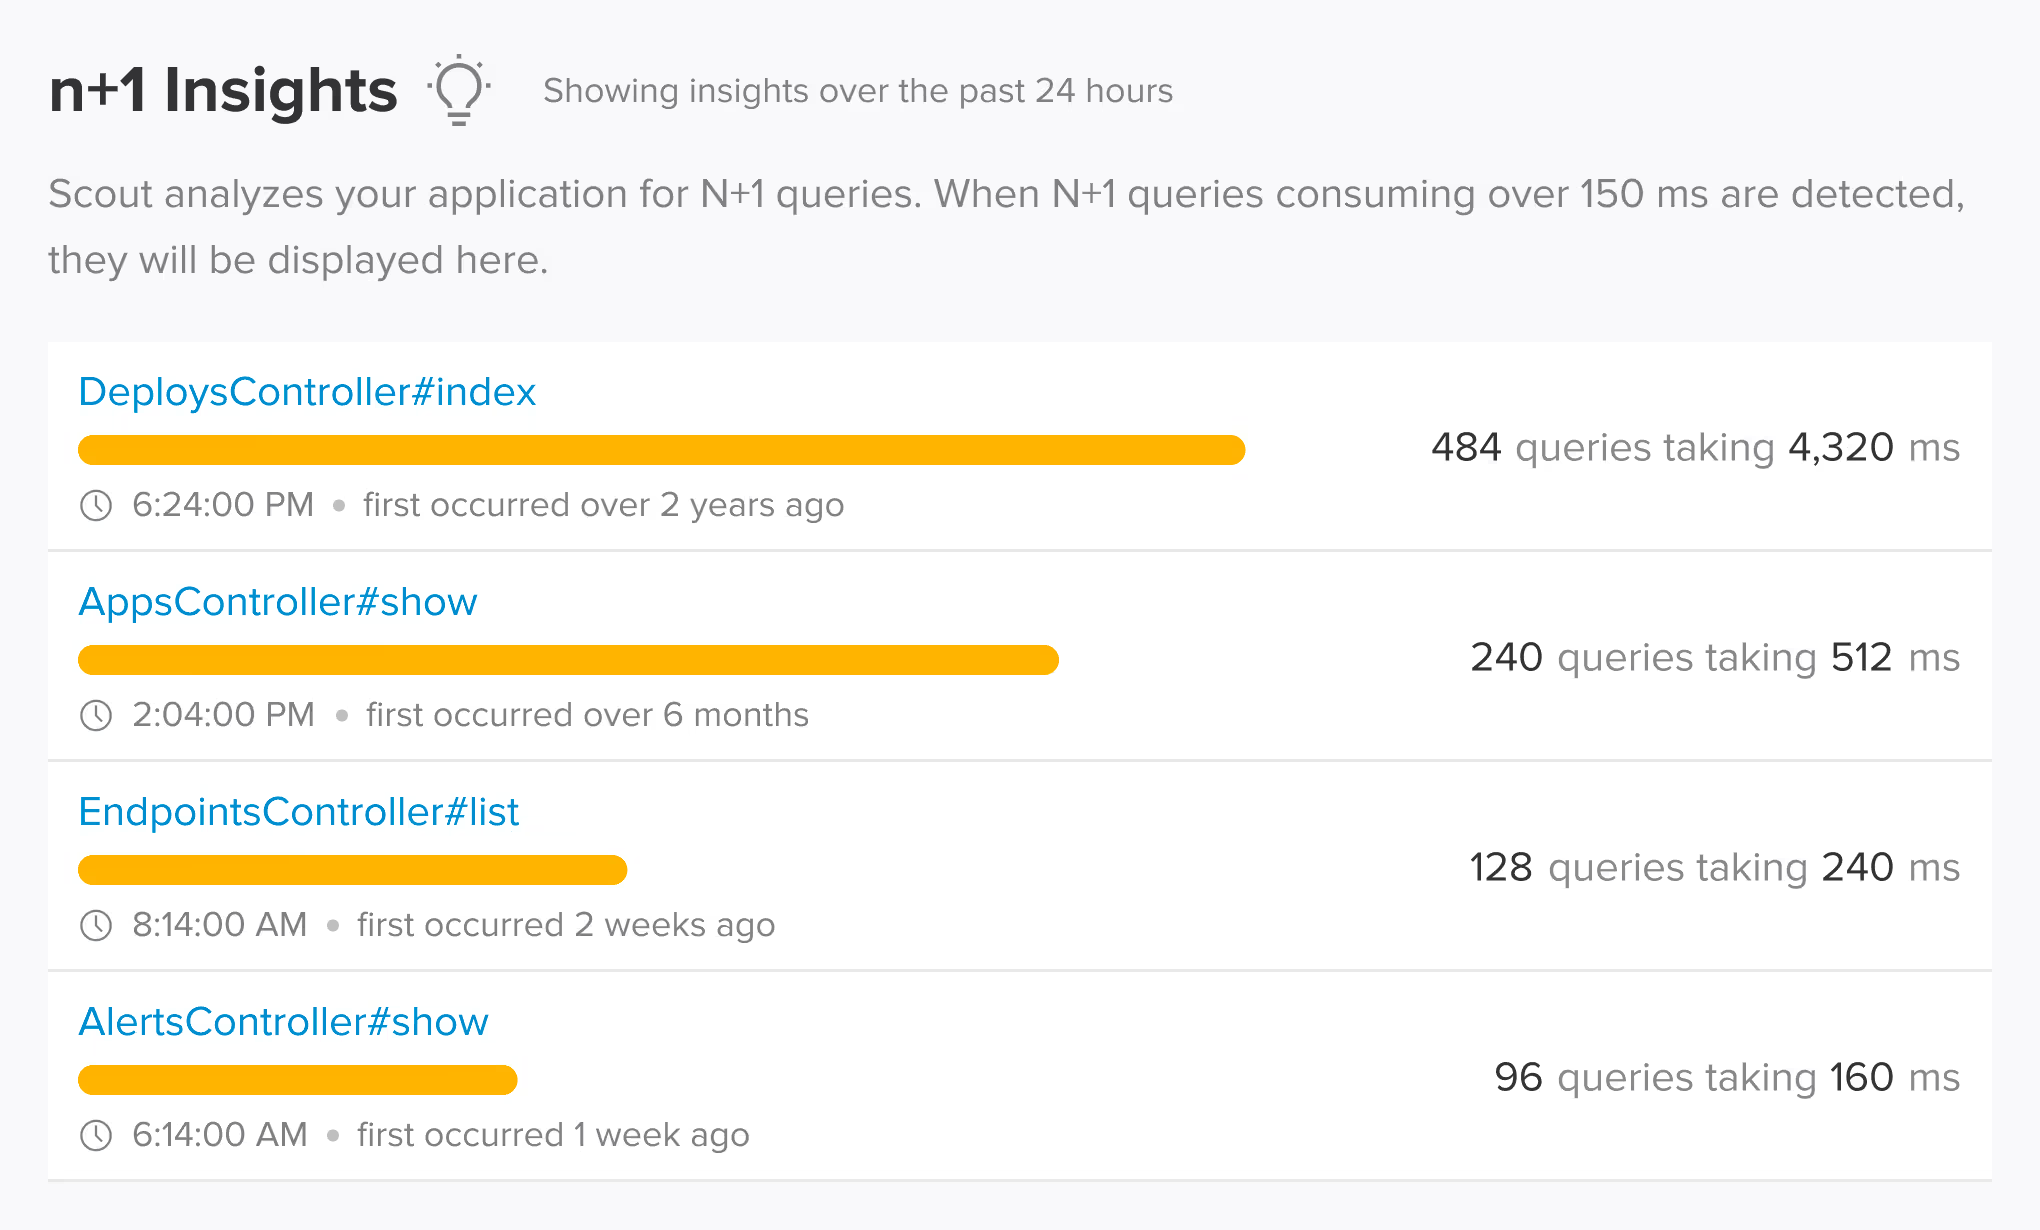
N+1 Detection in Eloquent for Lumen
Scout automatically detects N+1 query patterns in Eloquent within Lumen request handling. The agent monitors PDO queries, identifies repeated query patterns from lazy-loaded relationships, and shows the exact code location and performance impact of each N+1.
What Scout Instruments in Your Lumen App
Scout's PHP agent auto-instruments Lumen at the framework level. Controllers, Eloquent SQL queries, and external service calls are all captured automatically. PDO, Predis, PhpRedis, Elasticsearch, MongoDB, Memcached, and libcurl are instrumented with no additional configuration.
Works with the Lumen frameworks you already use
Scout auto-instruments the frameworks and libraries in your stack. No manual configuration required.
Framework
- Lumen
- Laravel
Databases
- Eloquent
- PDO
- MongoDB
- Elasticsearch
- Memcached
Caching
- Predis
- PhpRedis
HTTP
- libcurl
Memory Bloat Detection for Lumen
Lumen microservices handling high request volumes can accumulate memory over time. Scout detects memory bloat at the transaction level, showing which controllers and code paths are responsible for memory growth.
Query Your Lumen App Data from AI Assistants and the Terminal
Scout offers hosted and local MCP servers with 17 tools, a Go CLI available via Homebrew with TOON format for LLM output, and a public API. Query your Lumen application's errors, traces, and N+1 insights from Claude Code, Cursor, or the terminal.
MCP Server
Hosted or local MCP server with 17 tools covering apps, endpoints, traces, errors, insights, background jobs, and usage data. Works with Claude Code, Cursor, VS Code Copilot, and any MCP-enabled assistant.
Scout CLI
Go binary available via Homebrew. Query app metrics, endpoint performance, traces, error groups, and insights from the terminal. Outputs human-friendly tables or TOON format for LLM consumption.
Public API
Full programmatic access to your monitoring data for building custom integrations, dashboards, or automation workflows.
Add Scout to Your Lumen App
Get Scout running on your Lumen app in under 3 minutes.
Install the package:
composer require scoutapp/scout-apm-laravelConfigure in your .env file and deploy.
Lumen Monitoring FAQ
What is the best monitoring tool for Lumen?
Scout Monitoring provides integrated errors, logs, and traces for Lumen applications. The PHP agent instruments Lumen at the framework level with Eloquent N+1 detection, error monitoring, and auto-instrumentation for PDO, Redis, Elasticsearch, MongoDB, and Memcached.
How do I add APM to a Lumen microservice?
Install scout-apm-laravel via Composer, configure your Scout key in the .env file, and deploy. The agent instruments Lumen controllers, Eloquent queries, and external service calls automatically.
Does Scout detect N+1 queries in Lumen with Eloquent?
Yes. Scout automatically detects N+1 query patterns in Eloquent within Lumen request handling. The agent identifies repeated query patterns from lazy-loaded relationships and shows the exact code location and performance impact.
How is Lumen monitoring different from Laravel monitoring in Scout?
The core monitoring is the same: request tracing, Eloquent N+1 detection, memory bloat, and error capture. Lumen does not include Blade rendering or the full Laravel middleware stack, so those layers are absent from traces. The agent instruments whatever is present in your Lumen app.
Does Scout support error monitoring for Lumen?
Yes. Scout captures exceptions across Lumen controllers and middleware automatically. Each error is linked to the request trace with full stack traces and request context.
Does Scout work with Heroku for Lumen apps?
Yes. The Heroku addon automatically configures SCOUT_MONITOR and SCOUT_KEY. You only need to set SCOUT_NAME to identify your application. Scout supports Heroku's dyno-based architecture for Lumen applications.
Can I get Scout through AWS Marketplace?
Yes. Scout is available on AWS Marketplace for teams that prefer to consolidate monitoring spend with their AWS account. The same Lumen agent and features work regardless of how you purchase. See our AWS Marketplace listing at /aws-marketplace-application-monitoring for details.
Does Scout work with DigitalOcean for Lumen apps?
Yes. Scout is available as a DigitalOcean addon. It integrates with your existing DigitalOcean billing and works with Lumen applications running on DigitalOcean App Platform or Droplets.