Query Analysis with Industry Standard Insights
Identify slow queries, N+1 problems, and memory bloat before they impact your users. Scout's query analysis gives you the data you need to optimize database performance.
Base Database Decisions On Meaningful Data
No guessing at bottlenecks or manually timing operations. Scout's Query Analysis gives you concrete data about your most resource-intensive database operations, so you can make informed decisions about optimization and keep your application running smoothly.
Real-time monitoring
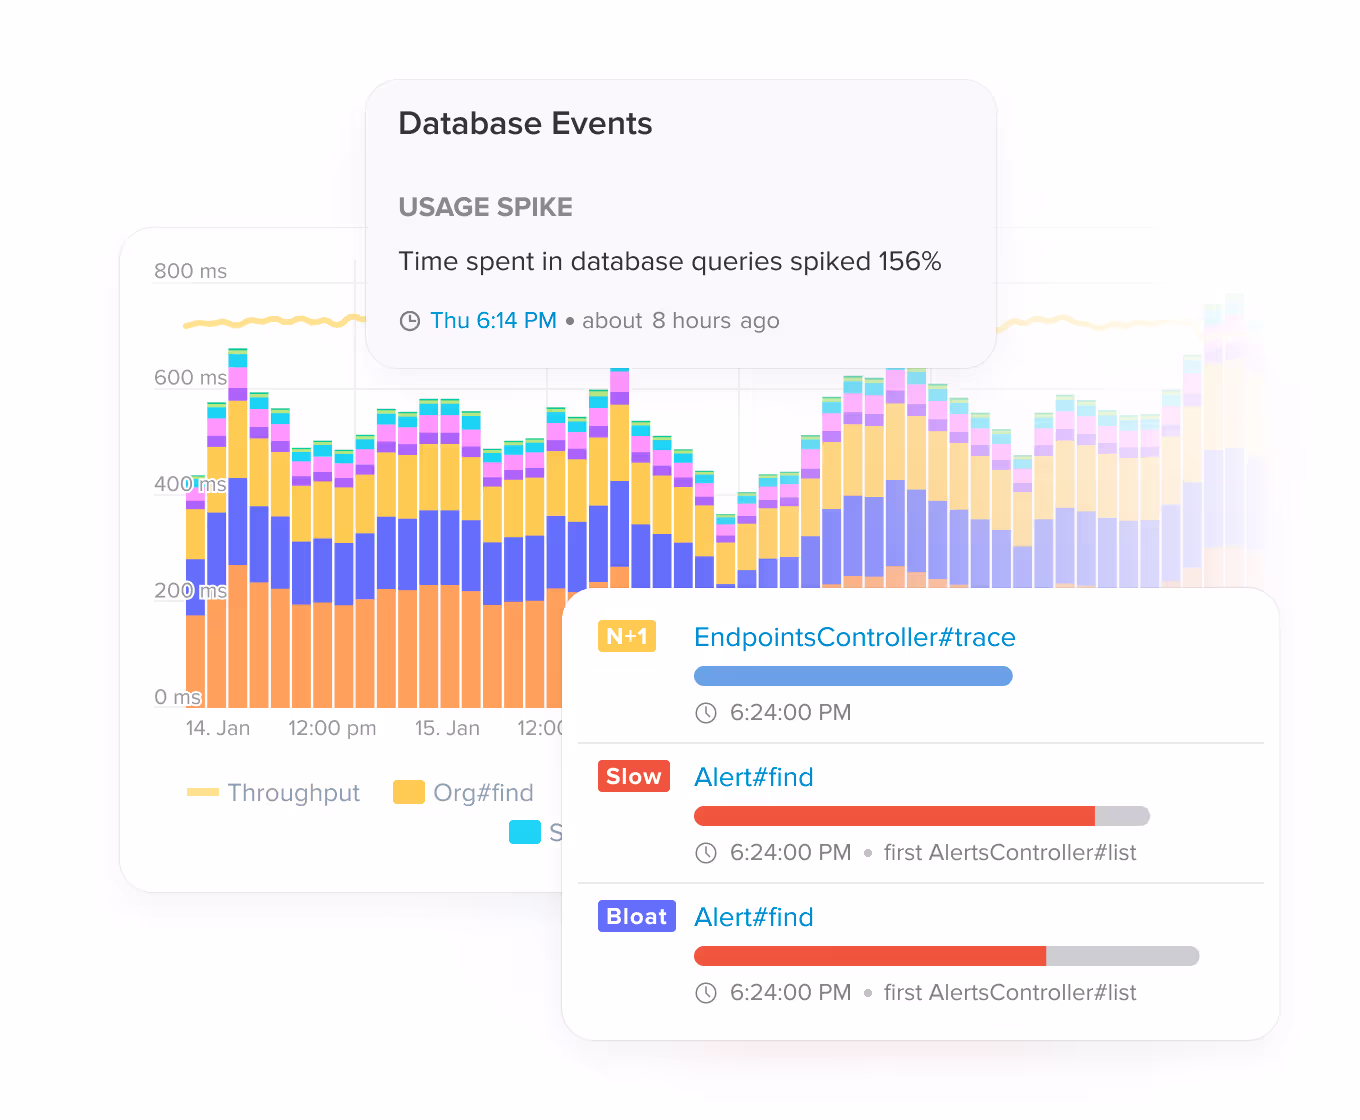
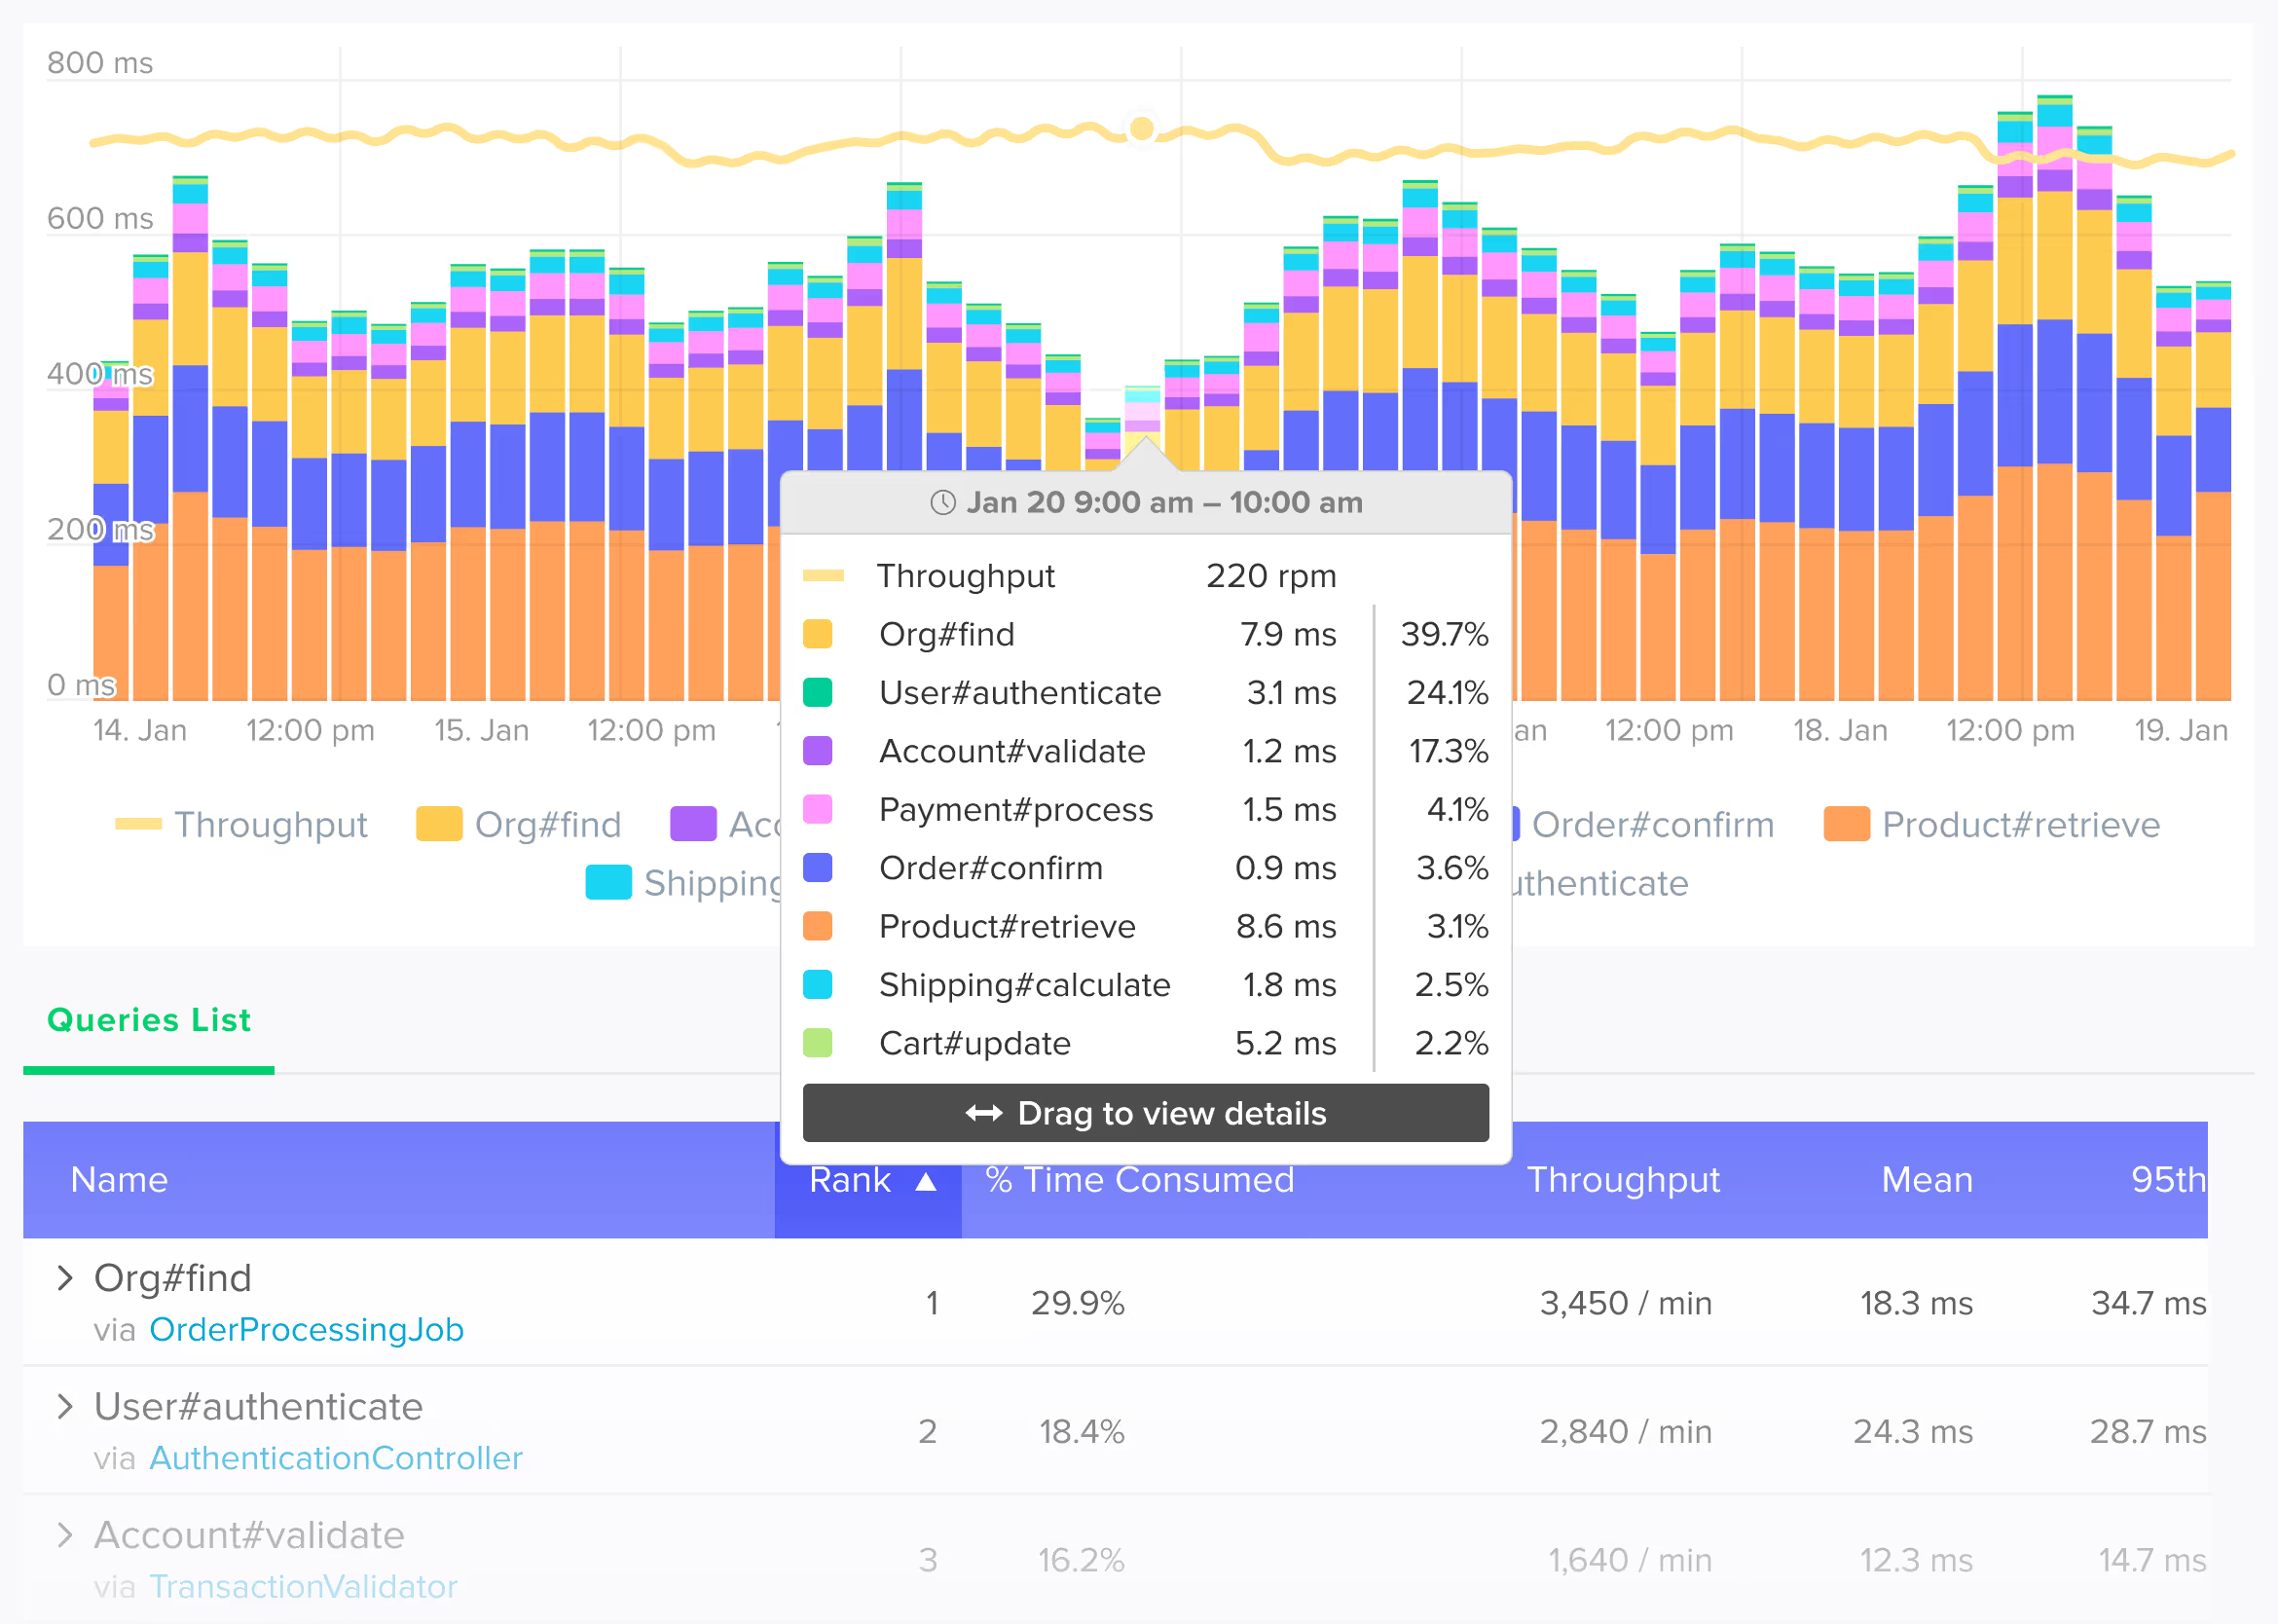
Real-time monitoring lets you track your application's throughput while drilling down into specific time periods to investigate performance issues. Whether you're looking at find operations, commits, or custom queries, you'll see exactly how much database time each one consumes.
Database events
Scout automatically detects and alerts on significant changes to database performance. When usage spikes occur – you'll know immediately, with the context you need to quickly diagnose and resolve database bottlenecks.
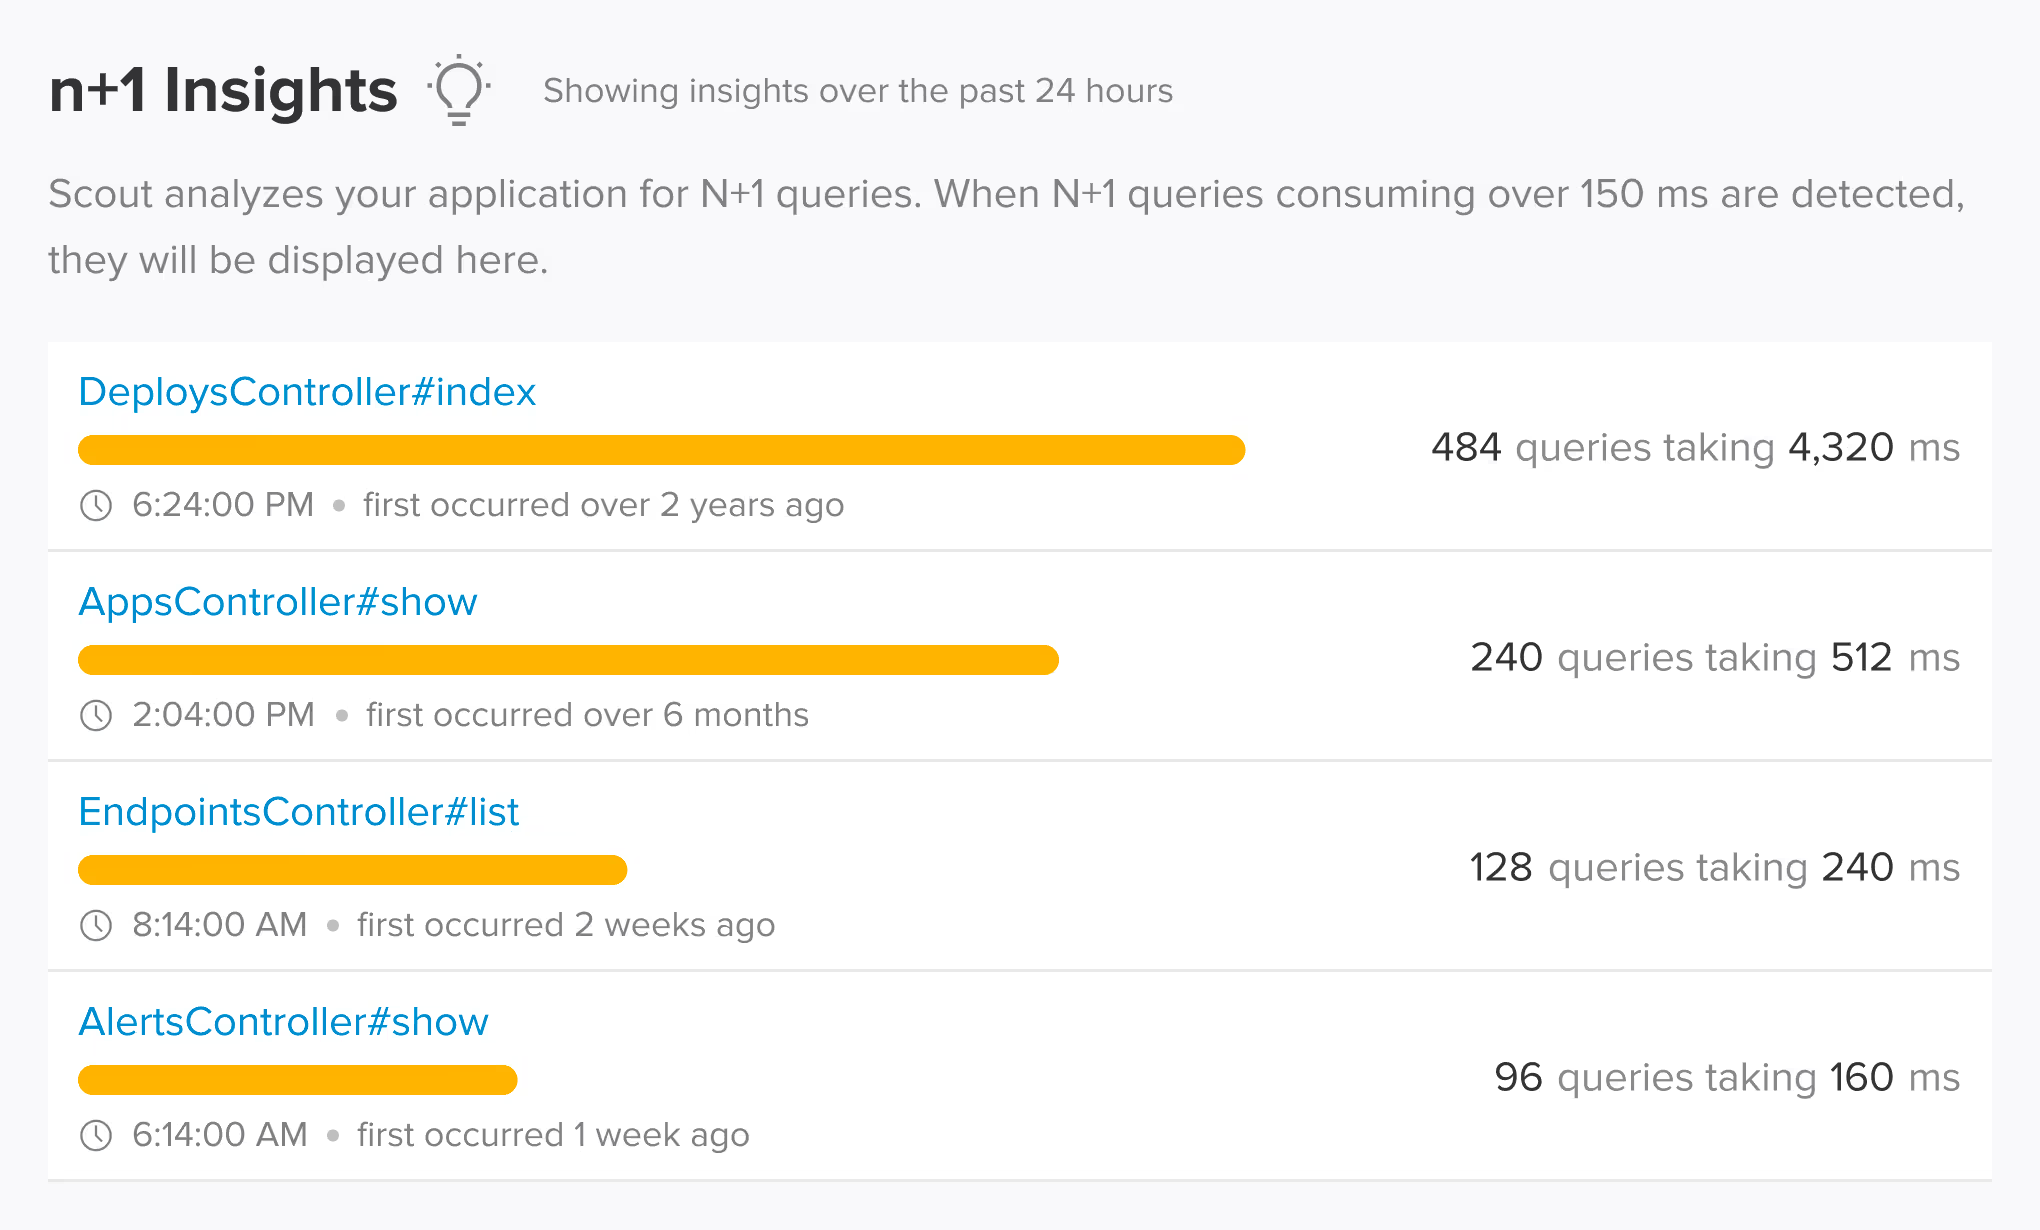
An Industry Standard for Solving N+1 Query Issues
When, instead of a single query, an N amount of individual queries are executed to retrieve related data, this results in a total of N+1 queries. Scout analyzes your traces and shows you the trace found to contain N+1s with UX impacts.
Query impact
See which database queries are consuming the most time and impacting overall performance.
Query bottlenecks
Identify queries causing significant slowdowns within your web endpoints and background jobs.
Slow queries
Track consistently slow-performing queries to prioritize your optimization efforts.
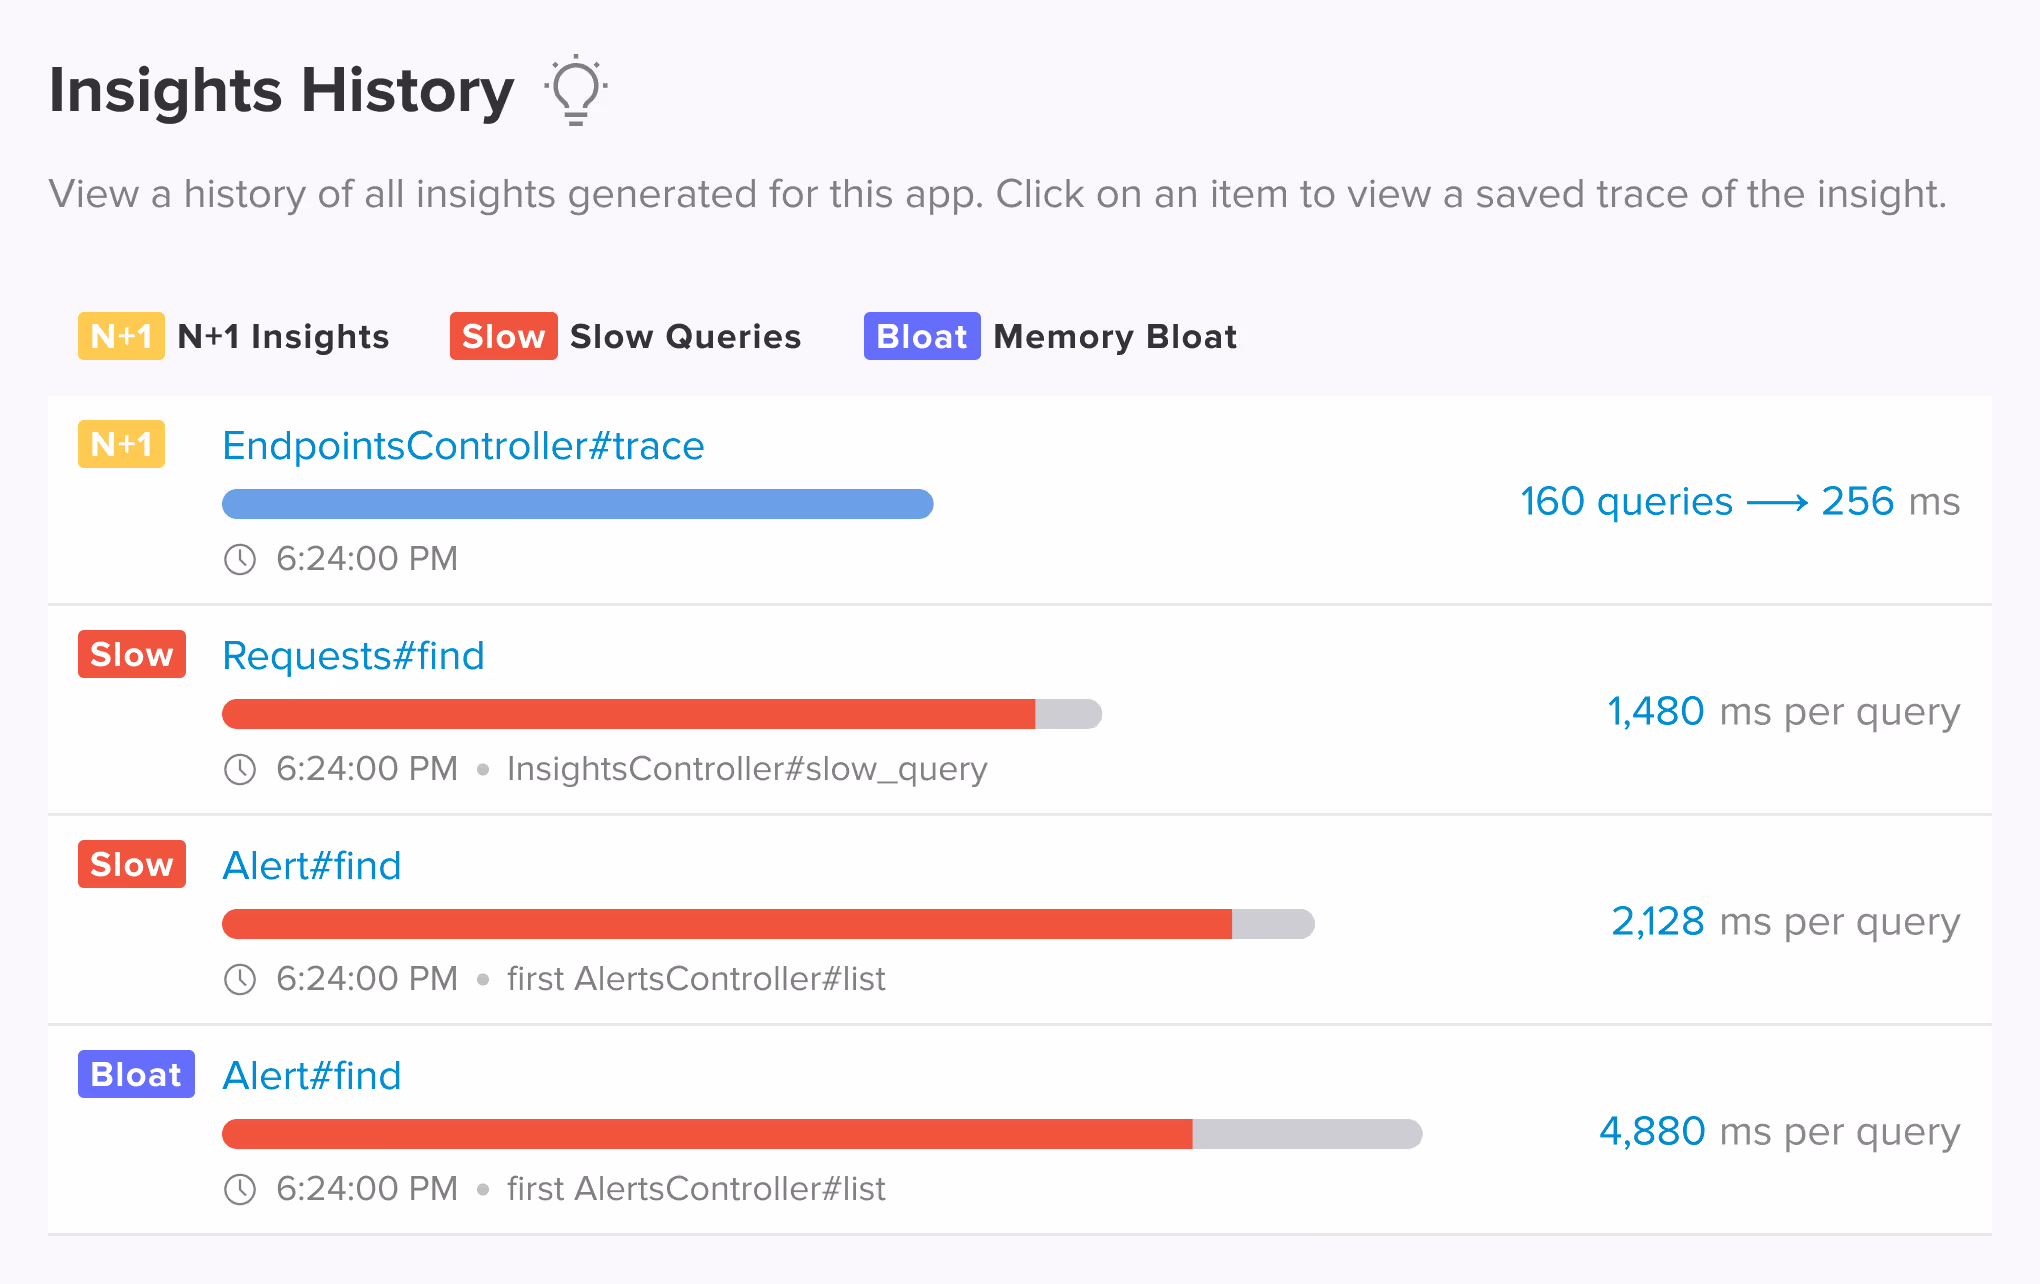
Insights From The Past
Scout users can also view past insights related to slow queries, N+1 queries, and memory bloat. These insights have a corresponding trace saved – and with a longer retention period.
Add Scout to Your App
With monitoring that "just works" for Rails, Django and more, get running in minutes with Scout's streamlined setup. No extra code needed - just deploy our agent and start getting insights in 5 minutes.
Get started in under 3 minutes with our easy to install Ruby agent.
Install our gem. In your Gemfile:
gem 'scout_apm'Shell:
bundle installDownload your customized config file, placing it at config/scout_apm.yml.
Deploy.
Get started in under 3 minutes with our easy to install Python agent.
Install the package:
pip install scout-apmConfigure in your settings.py (Django):
# settings.py
INSTALLED_APPS = [
    "scout_apm.django",  # should be listed first
    # ... other apps ...
]

# Scout settings
SCOUT_MONITOR = True
SCOUT_KEY = "[AVAILABLE IN THE SCOUT UI]"
SCOUT_NAME = "A FRIENDLY NAME FOR YOUR APP"
Alternatively, use environment variables: SCOUT_MONITOR, SCOUT_NAME, SCOUT_KEY.
Deploy. Data appears in the Scout UI within approximately 5 minutes.
Get started in under 3 minutes with our easy to install PHP agent.
Install the package:
composer require scoutapp/scout-apm-laravelOptionally install the PHP extension:
sudo pecl install scoutapmConfigure in your .env file and deploy.
Get started in under 3 minutes with our easy to install Elixir agent.
Add to your mix.exs and run mix deps.get:
{:scout_apm, "~> 2.0"}Download your customized config and place it at config/scout_apm.exs.
Add instrumentation to lib/your_app_web.ex:
defmodule YourApp.Web do
  def controller do
    quote do
      use Phoenix.Controller
use ScoutApm.InstrumentationDeploy.
Get started in under 5 minutes with our Node.js agent.
Install the package:
npm install @scout_apm/scout-apmCreate scout.js with your app name and key. Require it first in your entry point, before other packages.
Add middleware: Express uses expressMiddleware() and errorMiddleware(). NestJS uses nestMiddleware() and nestErrorFilter().
Deploy. Data appears in Scout within 5 minutes.