App Metrics and Clear Performance Insights
Get real-time visibility into your application's performance with comprehensive metrics covering response times, error rates, and throughput across all endpoints.
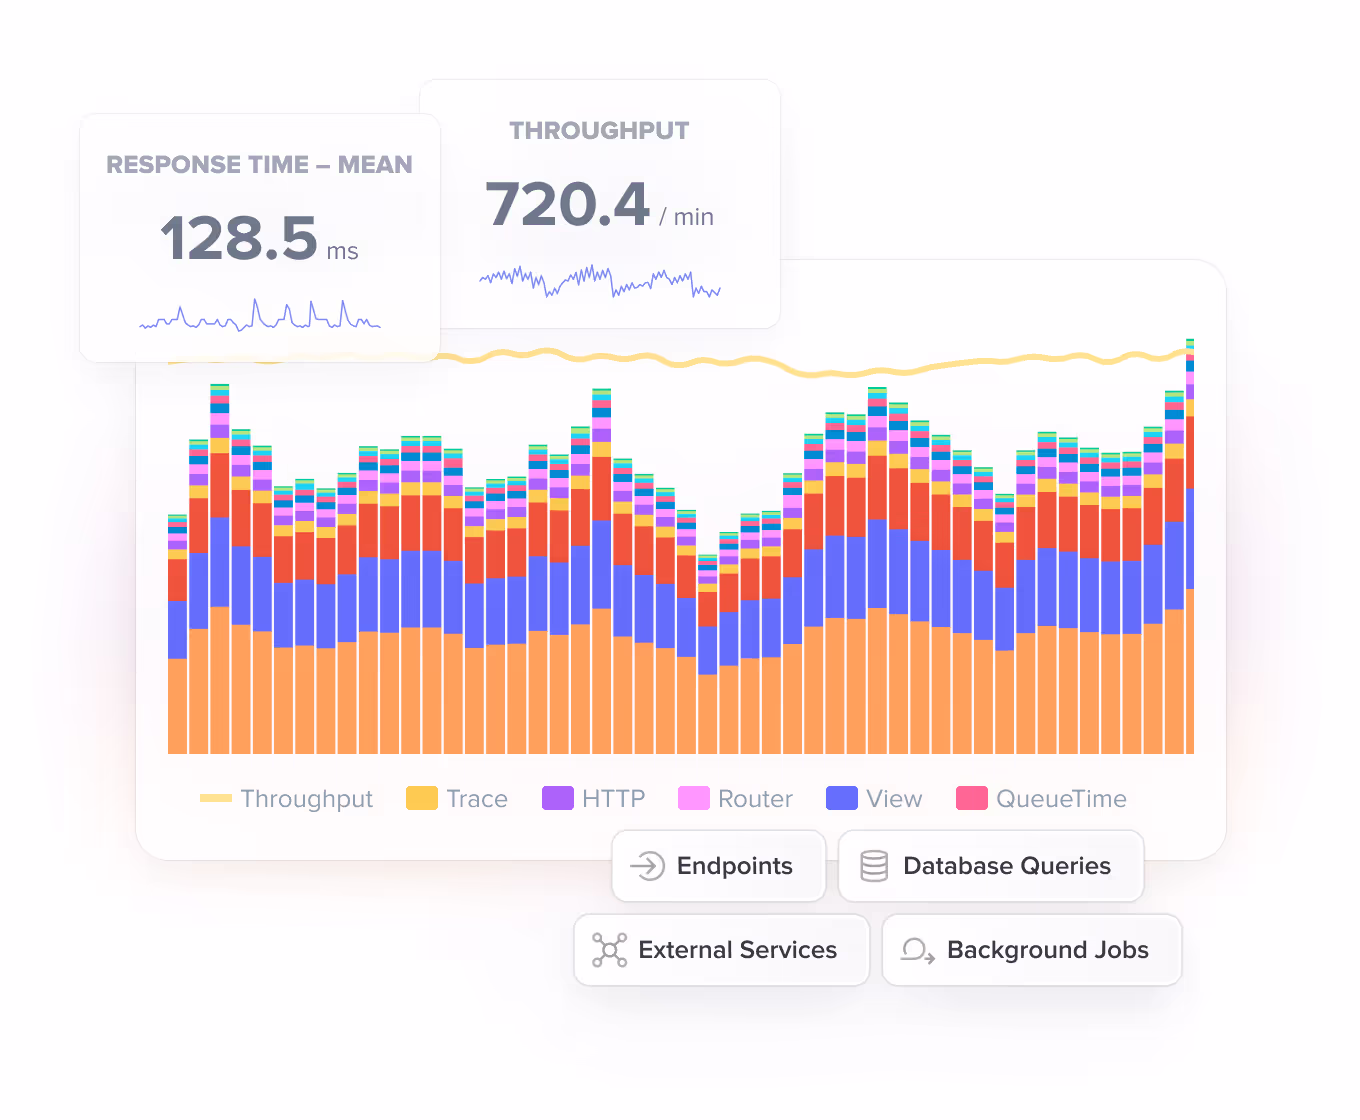
A Comprehensive Overview Page
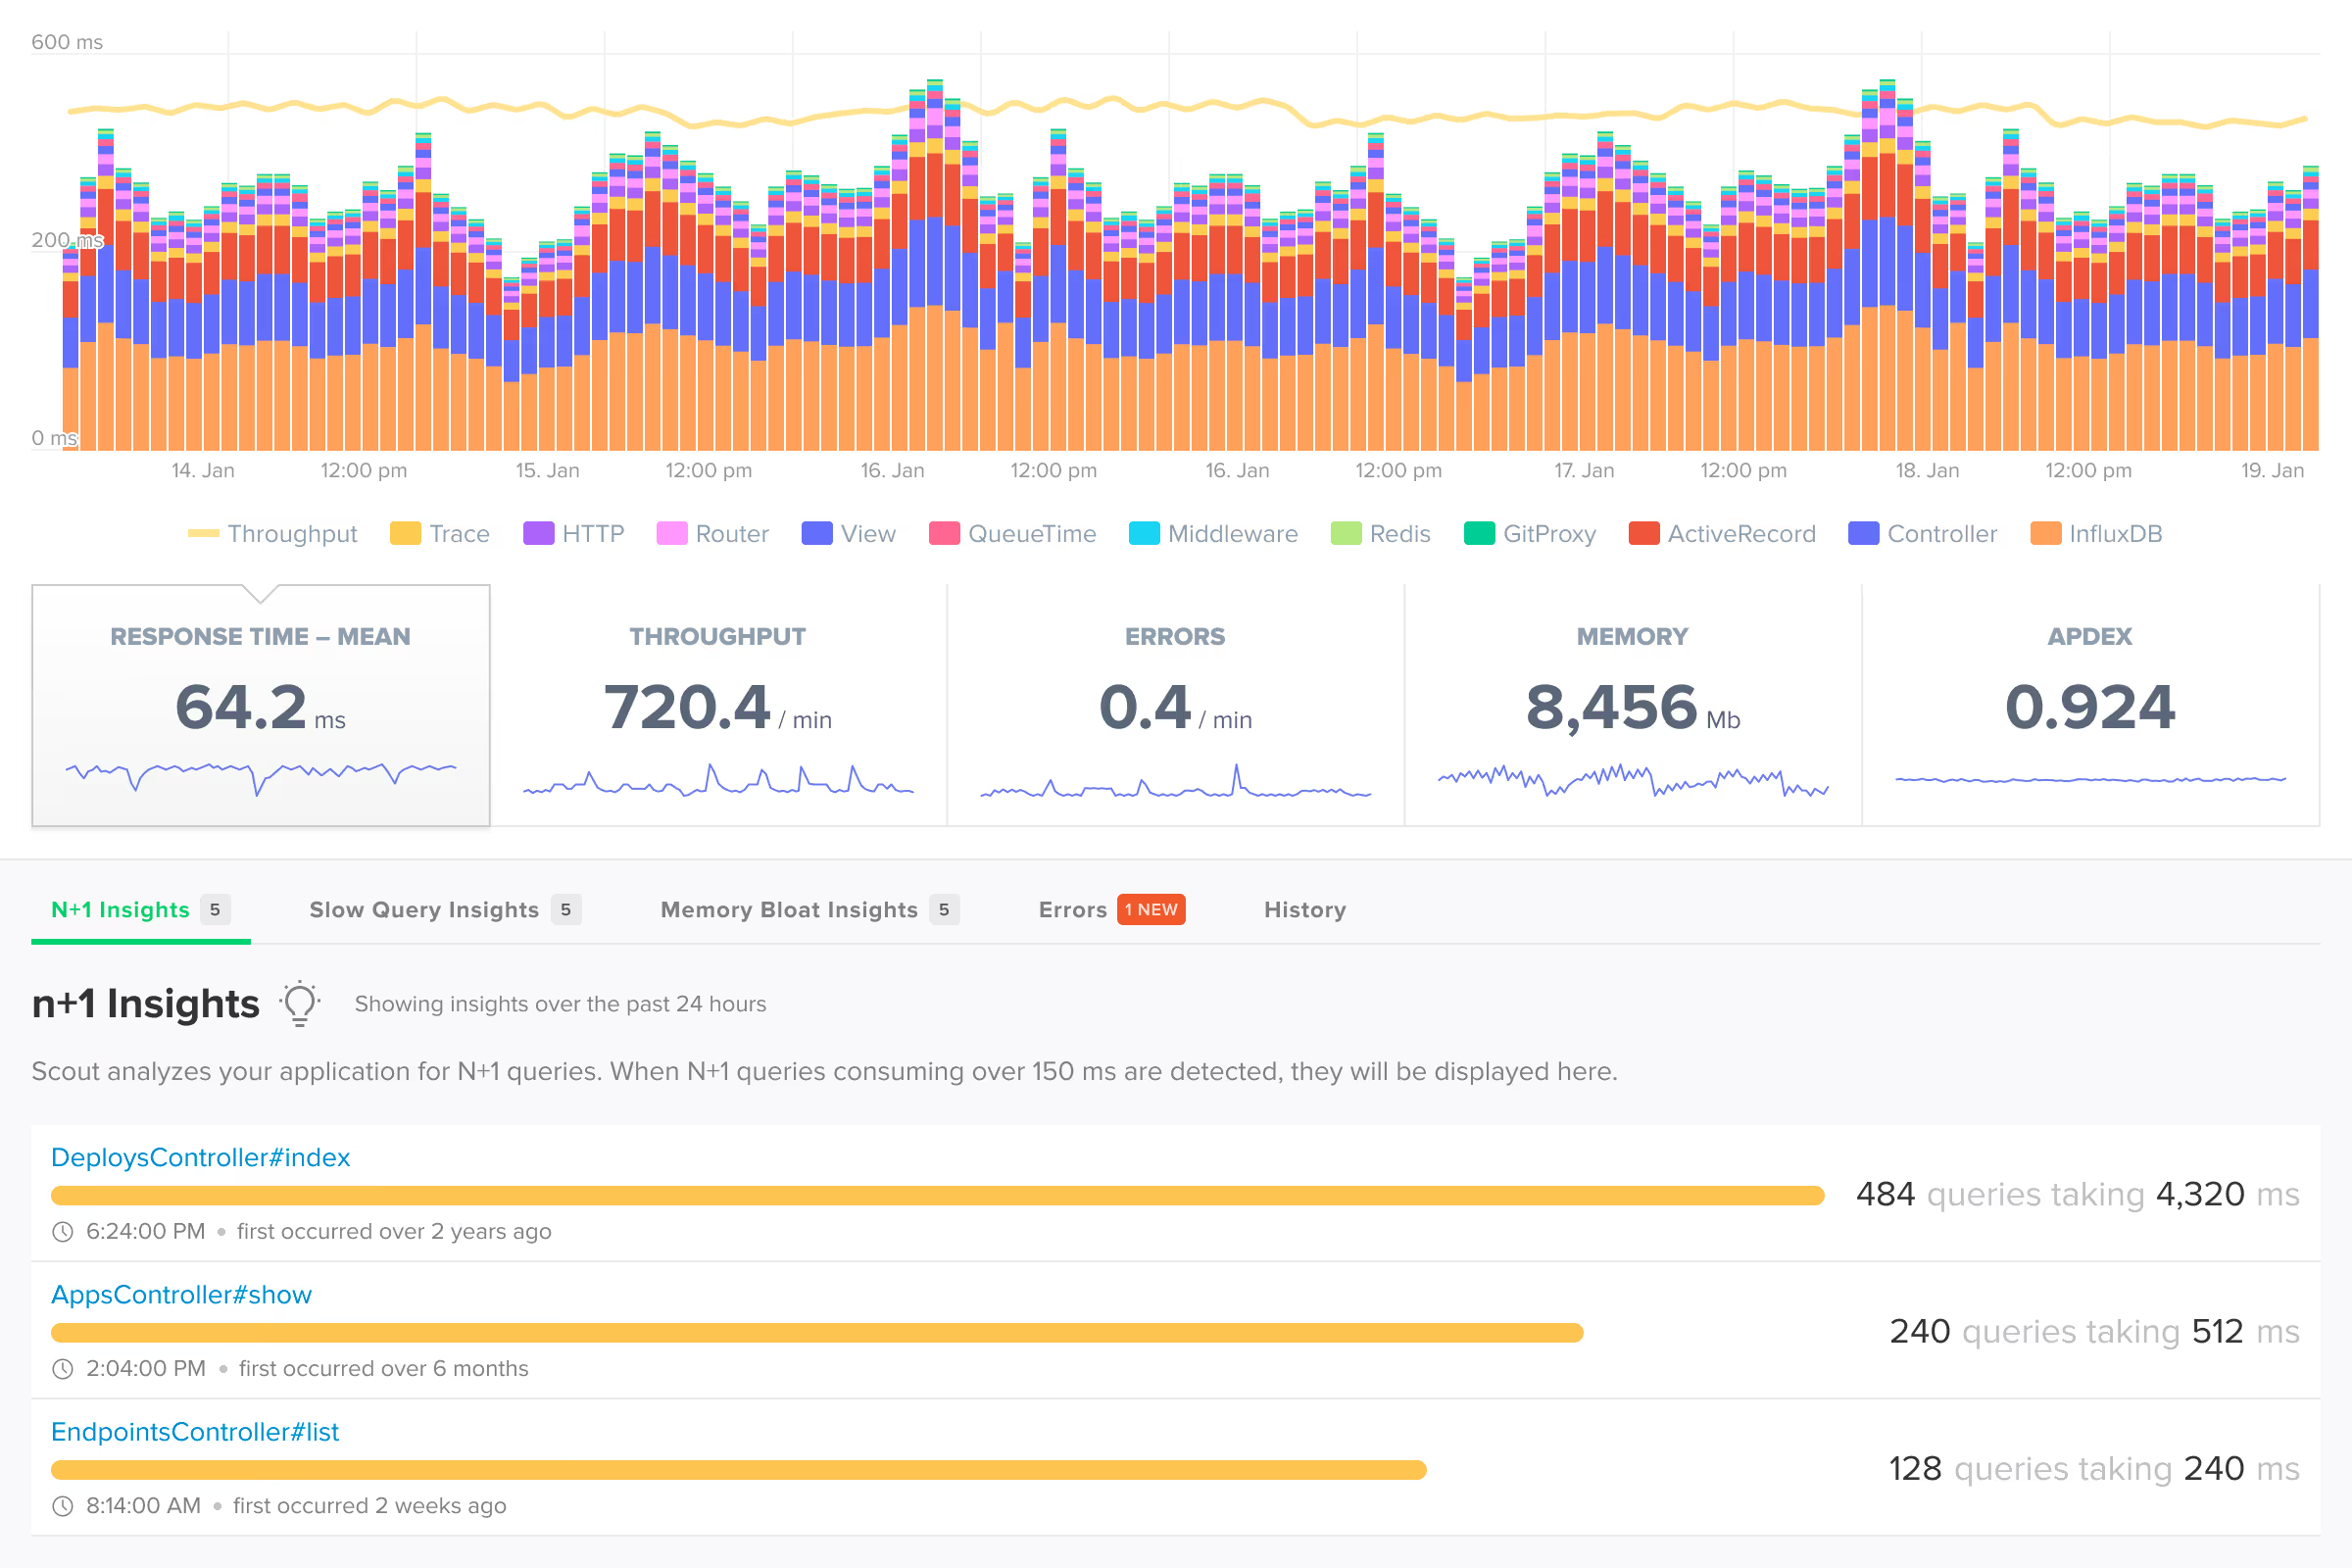
Get instant visibility of your app's vitals with our auto-refreshing dashboard. Track mean and 95th percentile response times, throughput, error rates – with clear, actionable visualizations. Compare current and historical data to spot trends and catch regressions.
Auto-refreshing dashboard
Live performance metrics, updated every minute for instant deploy feedback.
Dynamic annotations
Live performance metrics, updated every minute for instant deploy feedback.
30-day lookback window
Track a month of performance trends to quickly spot issues vs historical data.
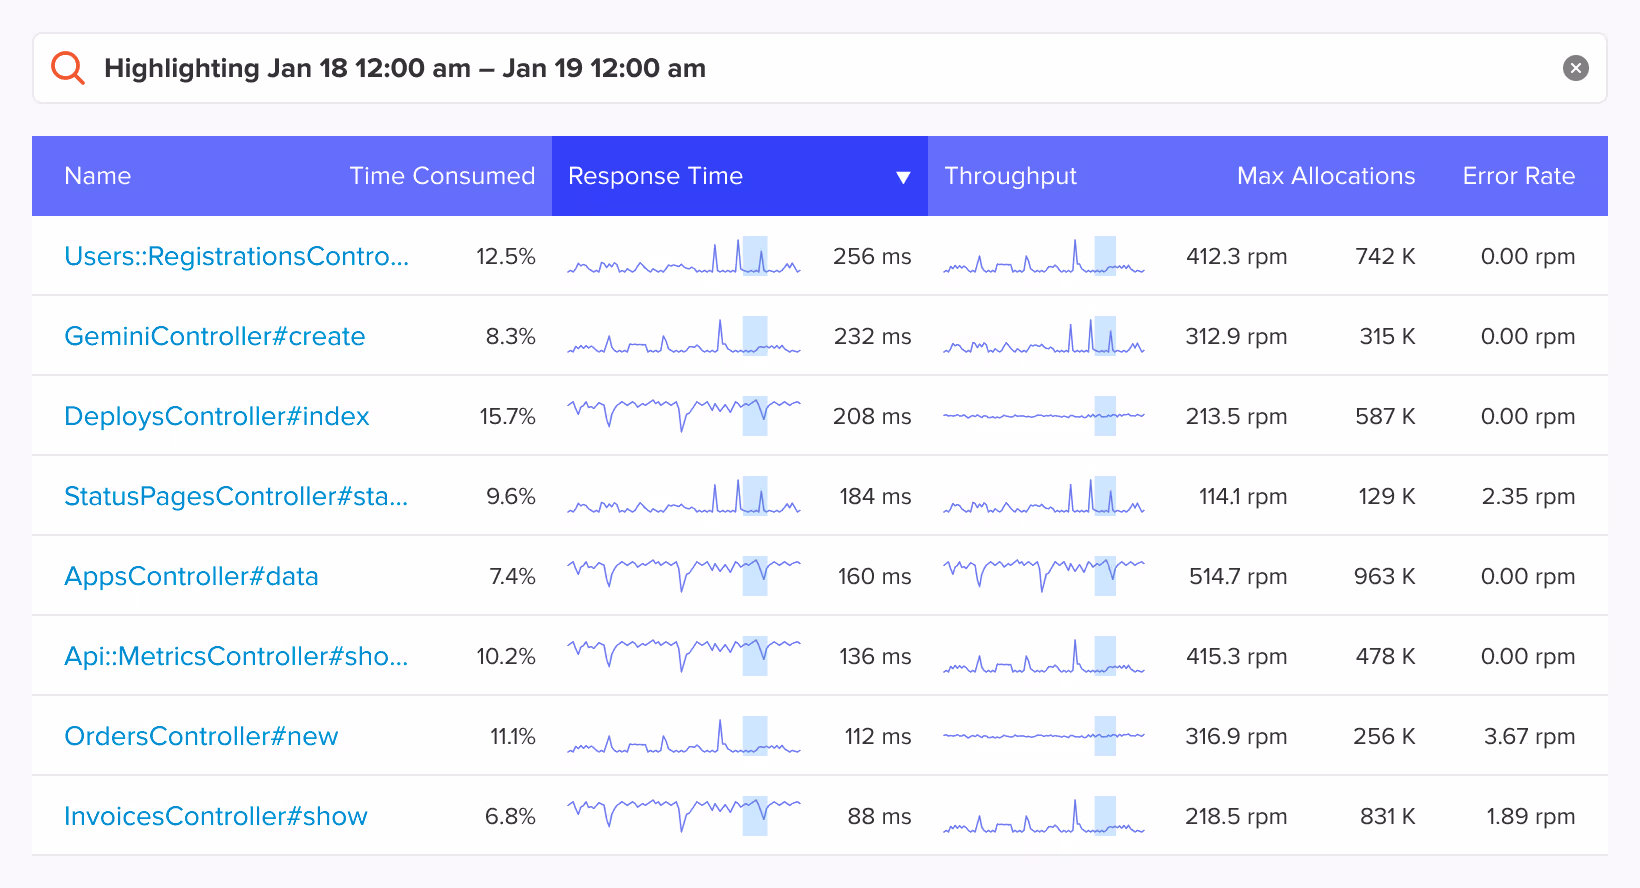
Endpoint Details – Above and Beyond
Explore your endpoints with comprehensive analytics showing time consumption rankings, throughput, memory allocations, and error rate hotspots. Zero in on specific timeframes to identify the endpoints contributing to performance issues, then confidently resolve them.
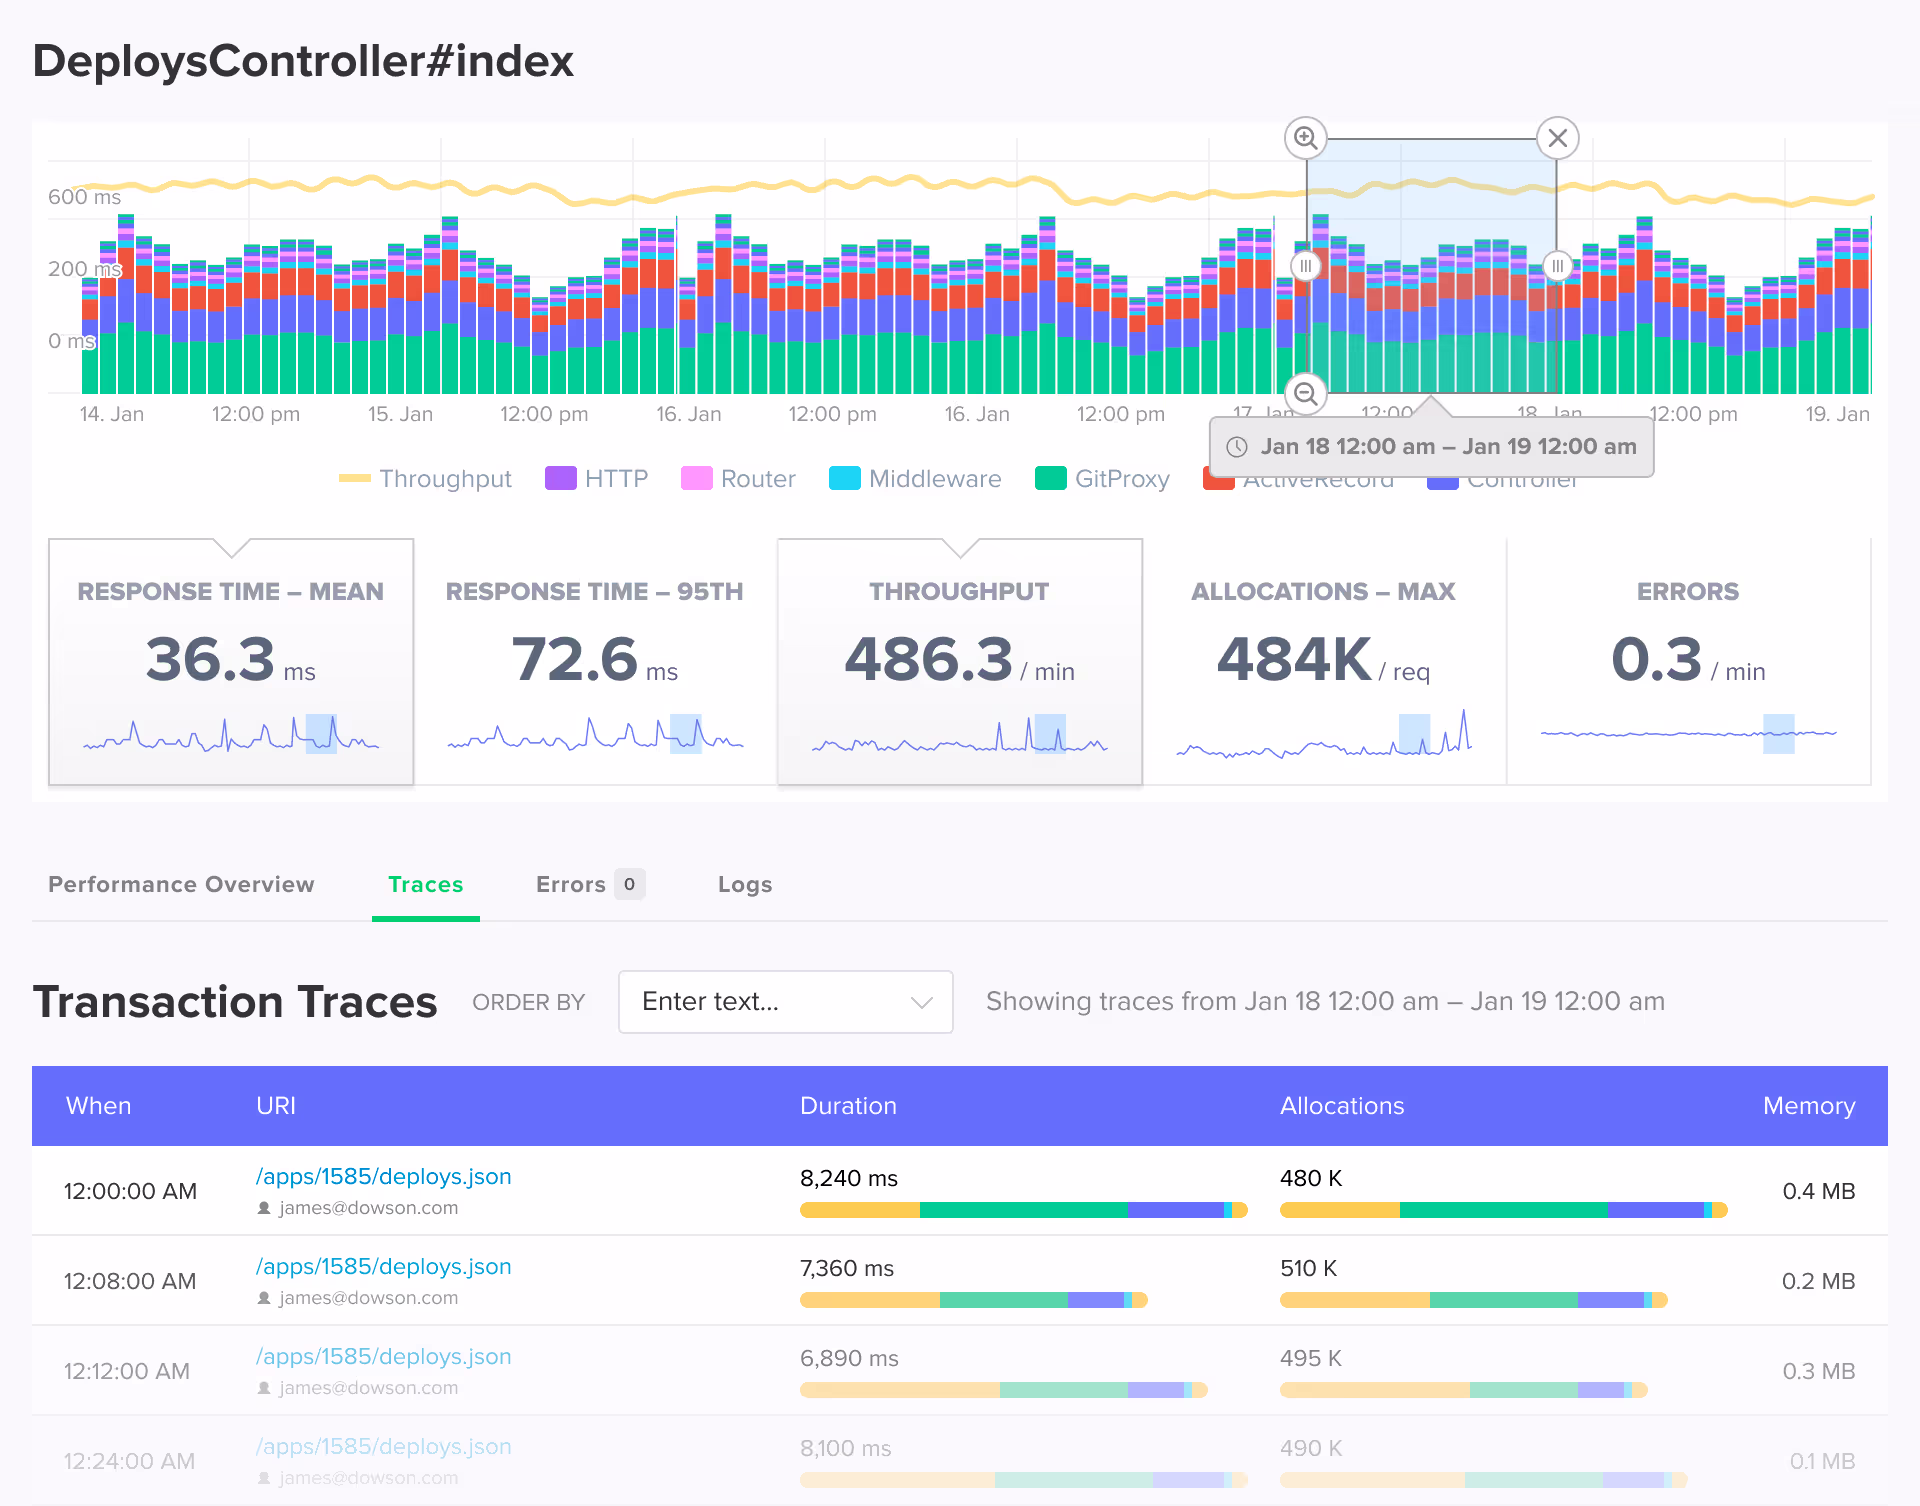
You can view metrics for specific controller-action and background job workers. There is a similar chart interaction to the App Performance Overview page, with one difference: your selection will render an updated list of transaction traces that correspond to the selected time period.
Endpoint metrics
Drill into metrics for specific controller actions or background job workers.
Transaction filters
Filter transaction traces by response time, object allocations, date, and more.
Dynamic charts
Leverage dynamic charts to update trace data for the selected time period.
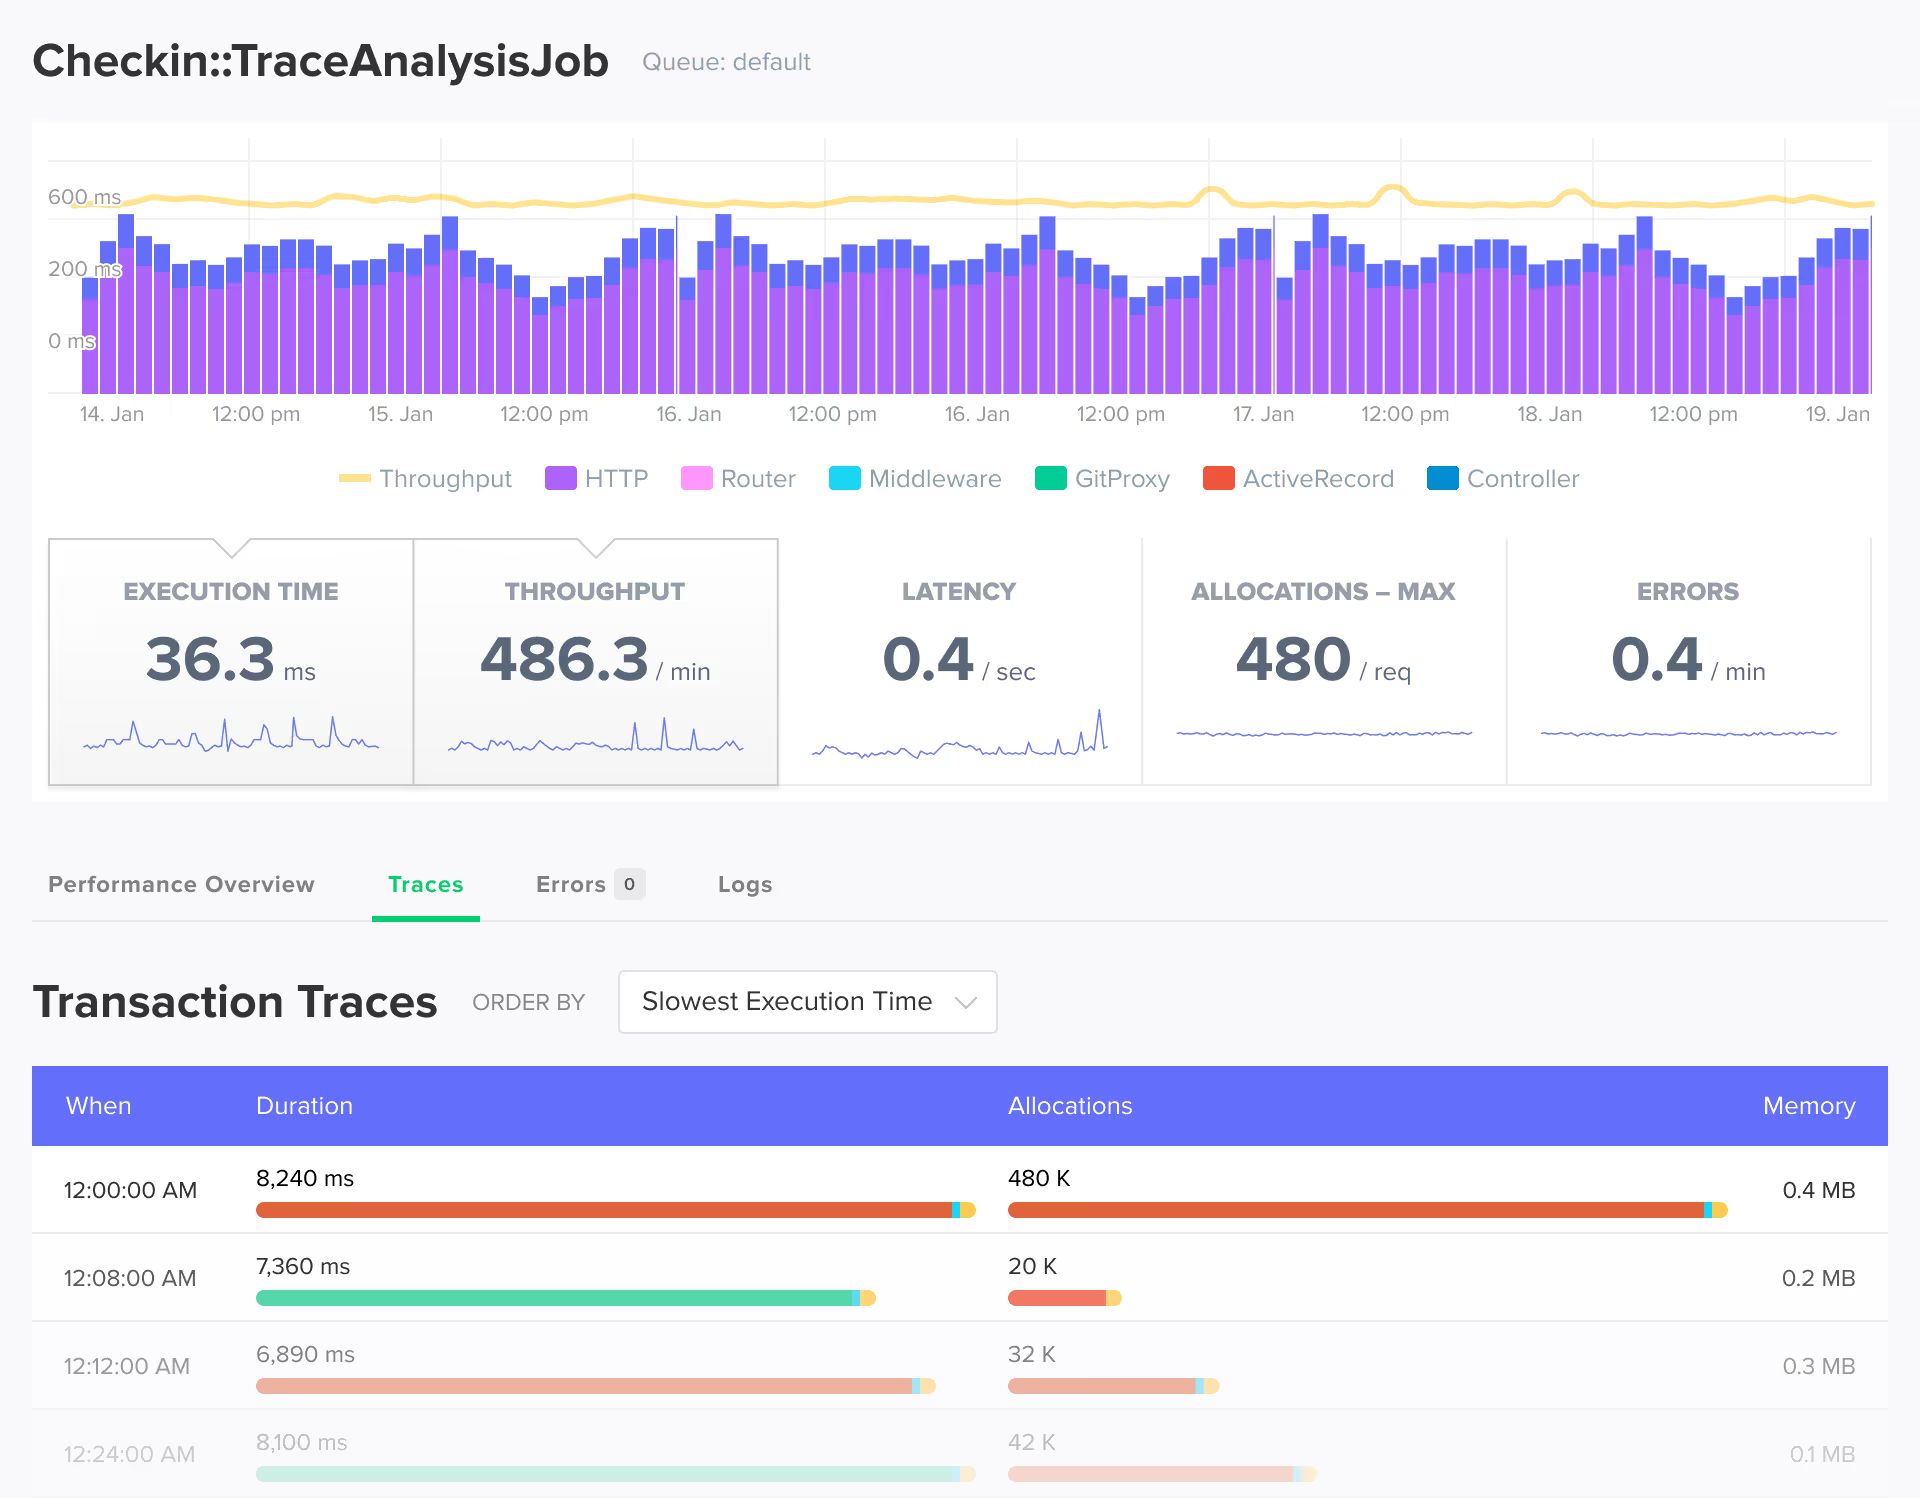
Keep Background Job Insights in the Foreground
Monitor your background workers with the same precision as your web endpoints. Track execution time, throughput, latency, memory allocations, and error rates to ensure your async processes run smoothly. Identify bottlenecks and optimize performance where it matters most.
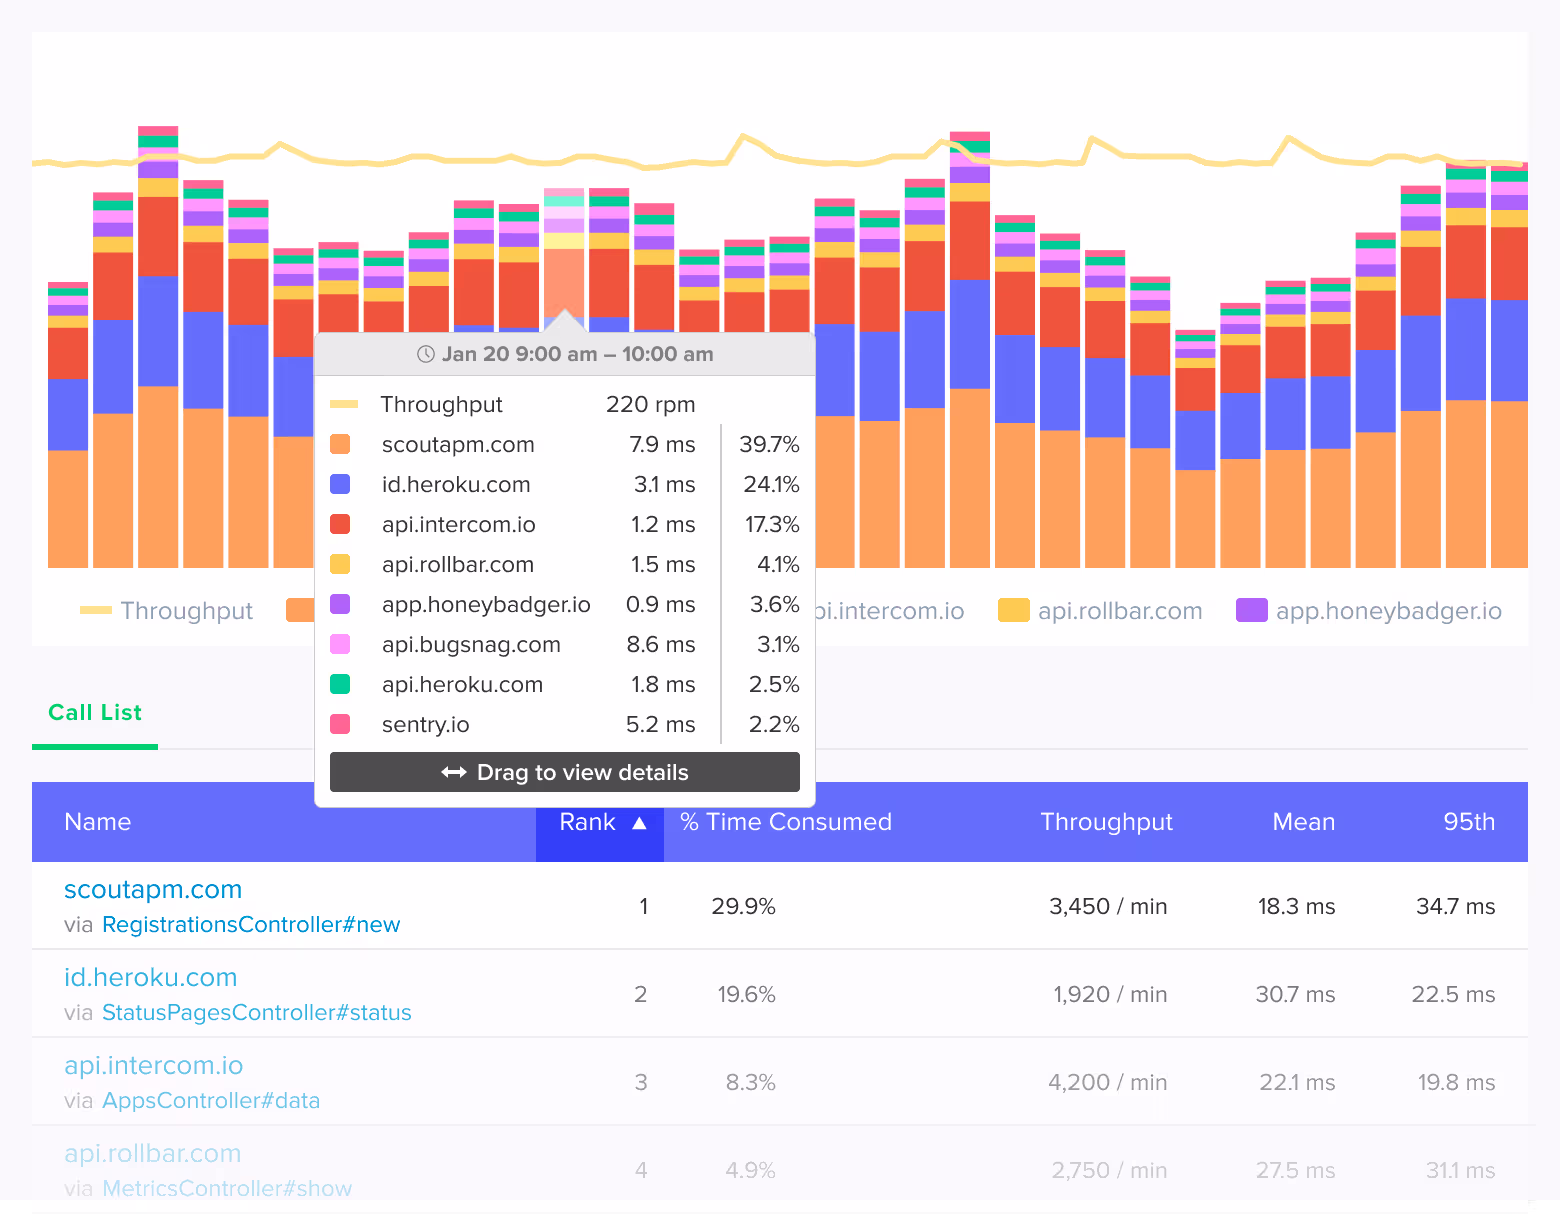
External Services Dashboard
Keep tabs on your application's external dependencies through our External Services Dashboard: get clear visibility into all your API calls, identify slow services, and see exactly where time is spent in your integrations.
Add Scout to Your App
With monitoring that "just works" for Rails, Django and more, get running in minutes with Scout's streamlined setup. No extra code needed - just deploy our agent and start getting insights in 5 minutes.
Get started in under 3 minutes with our easy to install Ruby agent.
Install our gem. In your Gemfile:
gem 'scout_apm'Shell:
bundle installDownload your customized config file, placing it at config/scout_apm.yml.
Deploy.
Get started in under 3 minutes with our easy to install Python agent.
Install the package:
pip install scout-apmConfigure in your settings.py (Django):
# settings.py
INSTALLED_APPS = [
    "scout_apm.django",  # should be listed first
    # ... other apps ...
]

# Scout settings
SCOUT_MONITOR = True
SCOUT_KEY = "[AVAILABLE IN THE SCOUT UI]"
SCOUT_NAME = "A FRIENDLY NAME FOR YOUR APP"
Alternatively, use environment variables: SCOUT_MONITOR, SCOUT_NAME, SCOUT_KEY.
Deploy. Data appears in the Scout UI within approximately 5 minutes.
Get started in under 3 minutes with our easy to install PHP agent.
Install the package:
composer require scoutapp/scout-apm-laravelOptionally install the PHP extension:
sudo pecl install scoutapmConfigure in your .env file and deploy.
Get started in under 3 minutes with our easy to install Elixir agent.
Add to your mix.exs and run mix deps.get:
{:scout_apm, "~> 2.0"}Download your customized config and place it at config/scout_apm.exs.
Add instrumentation to lib/your_app_web.ex:
defmodule YourApp.Web do
  def controller do
    quote do
      use Phoenix.Controller
use ScoutApm.InstrumentationDeploy.