Log Management, Integrated and Intuitive
Put your logs exactly where they belong – right next to Scout's monitoring and performance metrics! Our Log Management solution simplifies debugging by integrating logs and APM data in one intuitive interface.
Scout Monitoring and Log Management – Together At Last!
Stop juggling multiple tools and let Scout bring your logs and performance data together! Fast setup and flexible filtering give you exactly the log data you need, when you need it, with integrated insights on your performance metrics. Even more conveniently – complete integration with Scout Monitoring.
Automatic context
Analyze logs and performance data together through automatic context sharing.
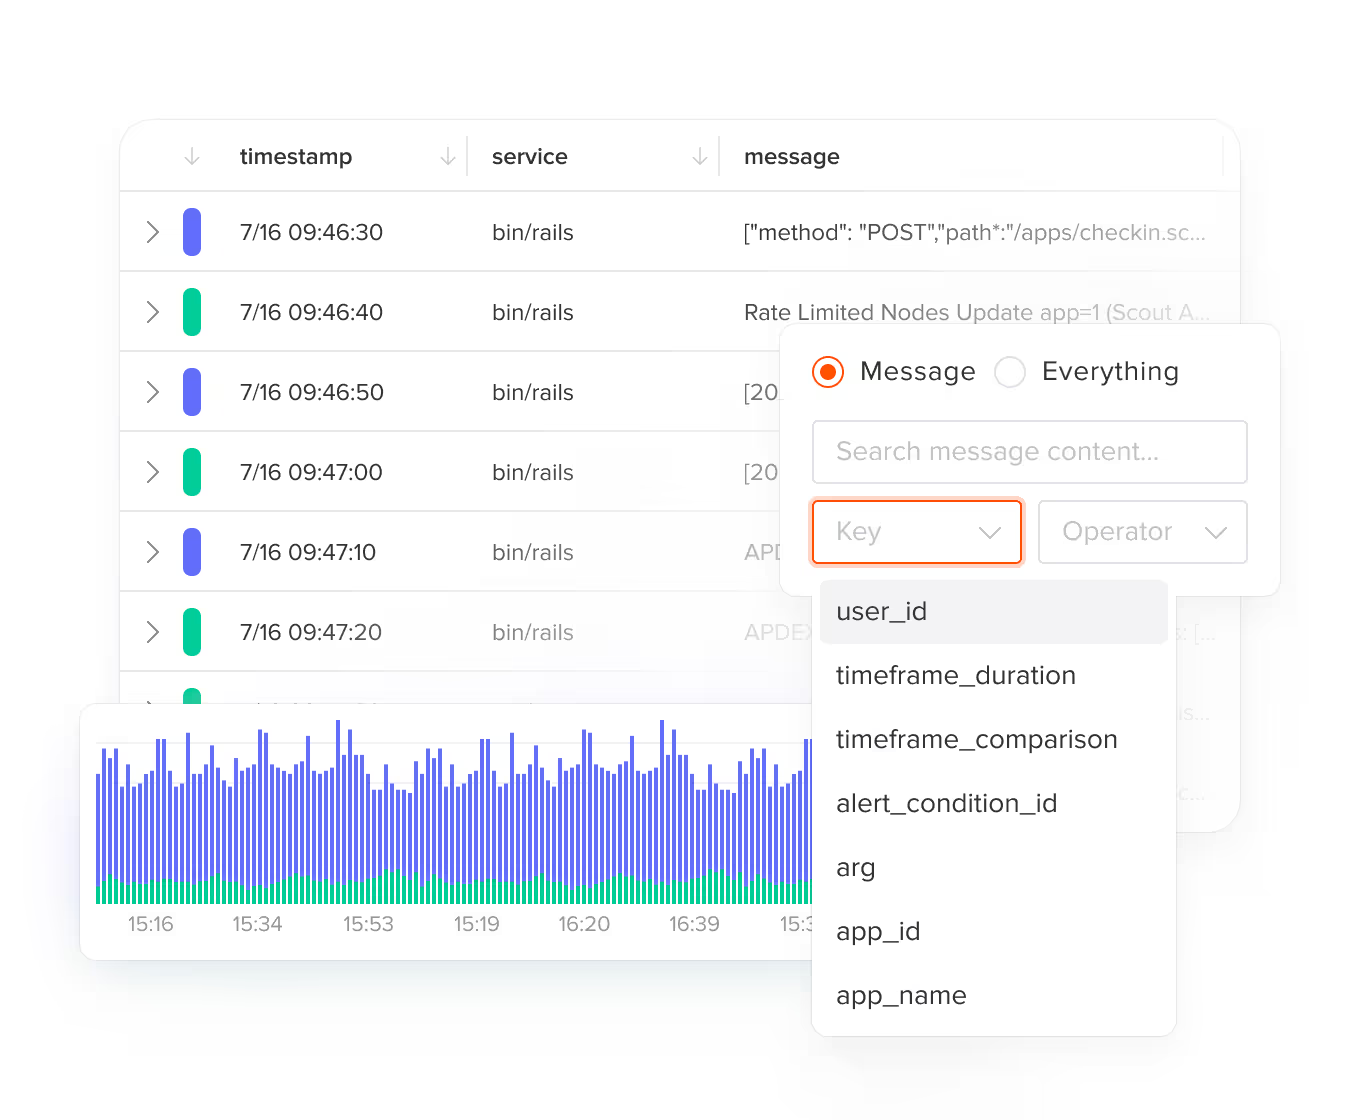
Quick filtering
Filter instantly by controller actions and endpoint to zero in on relevant logs.
Origin tracking
Track every log's origin through built-in file and entry point monitoring.
Custom insights
Add custom context to logs for deeper visibility into your application.
Efficient and Fast Logging
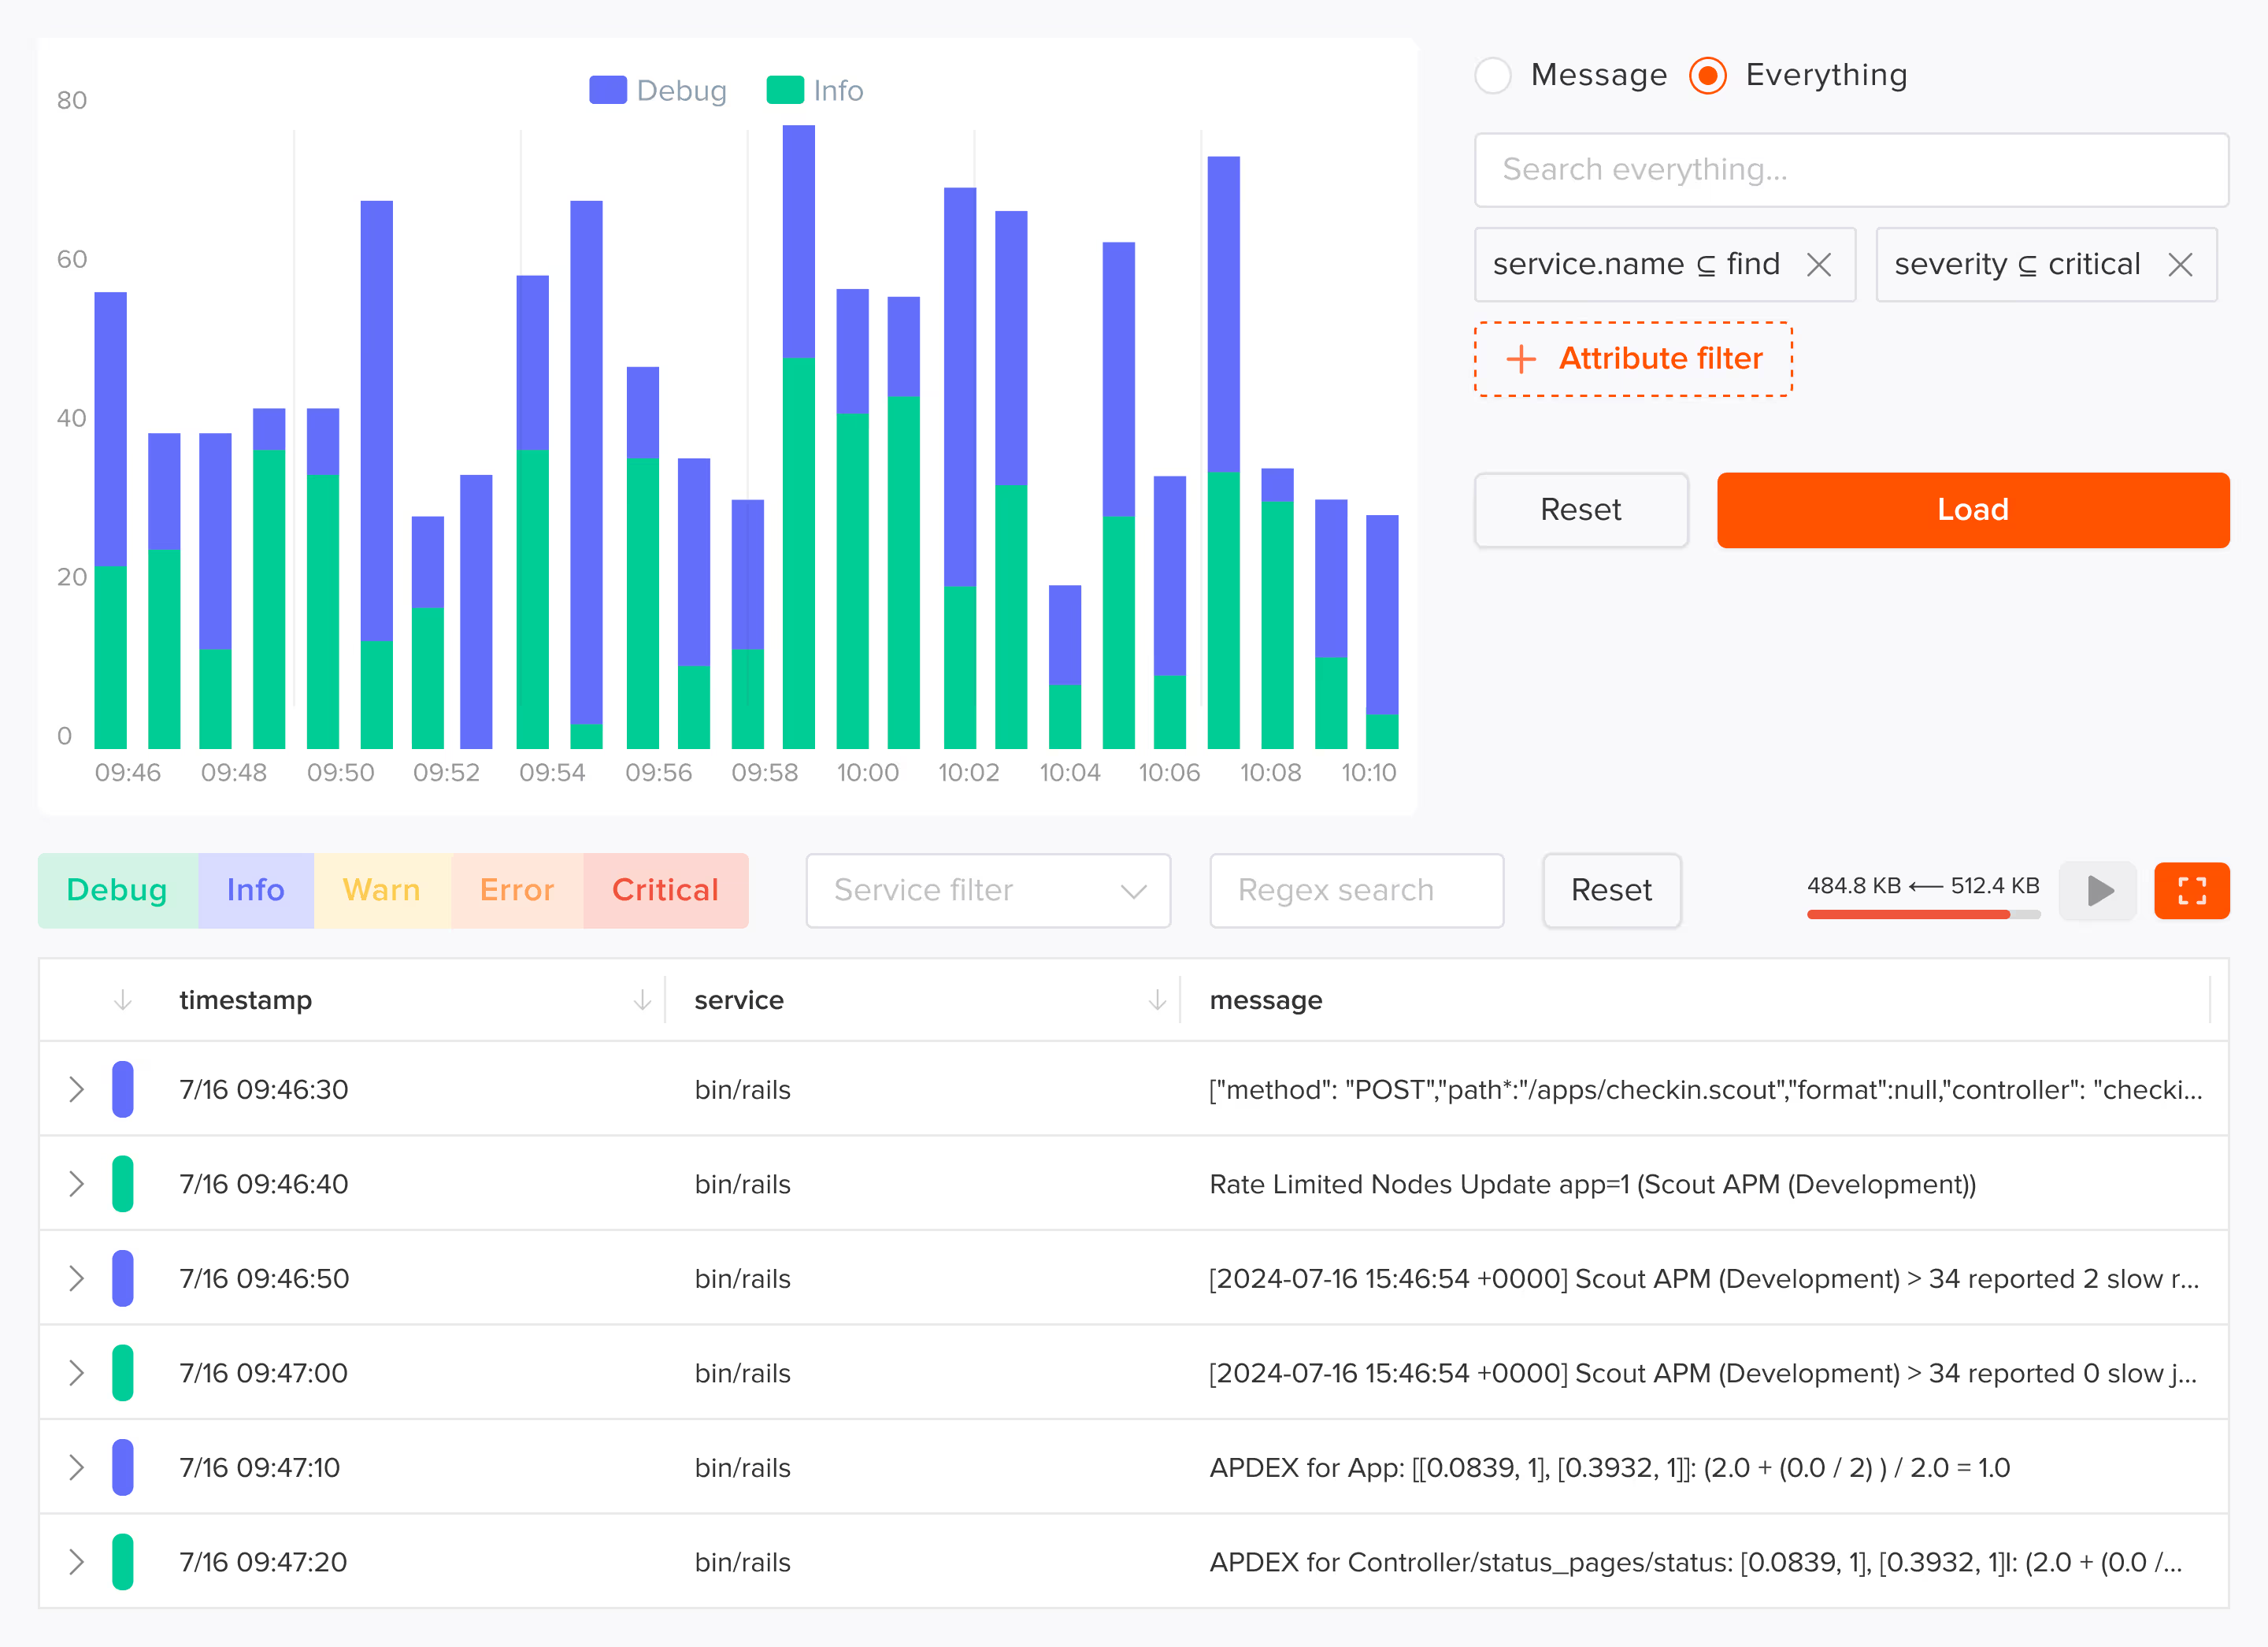
Find exactly what you need, when you need it. Our two-phase filtering approach lets you efficiently scan massive amounts of log data without getting bogged down, with the specific features you need
Endpoint filtering
Instantly locate and filter logs by specific controller actions and endpoints for focused debugging
Pre-load search
Narrow your search parameters before loading data to efficiently explore large log volumes
Regex search
Filter loaded logs in real-time using powerful regex patterns to find exact matches
Progress tracking
Monitor log loading progress with clear indicators showing scanned and processed data
Full screen view
Expand logs to full screen for detailed analysis and enhanced visualization
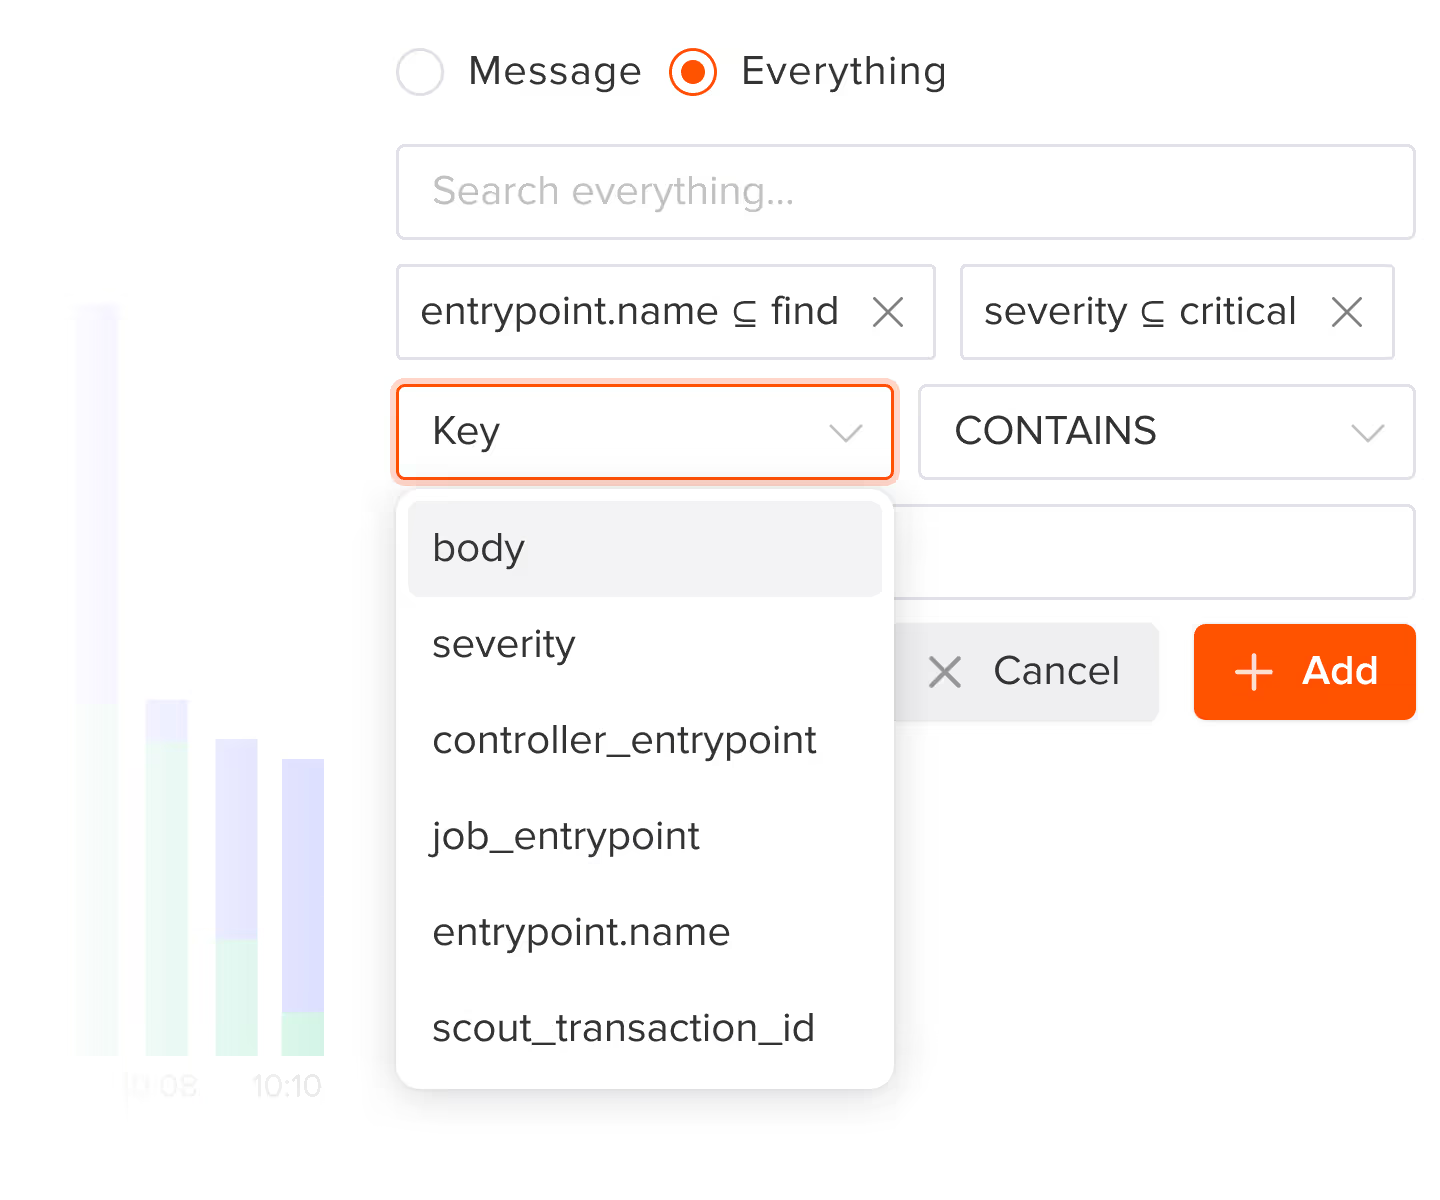
Custom filters
Apply targeted filters by severity, time range, or custom attributes to pinpoint relevant logs
Smart Data Management
Scout keeps your logging data organized and accessible! Understand your data flow with ingestion and retrieval real-time metrics. Monitor both write and read operations to optimize your logging strategy and stay on top of usage patterns. All logs are retained for 14 days, with flexible severity level filtering to help you focus on what matters.
Pricing that Makes Sense
Straightforward and transparent pricing means you can sweat about your application – not your bill. Start with our free tier or scale up:
- Start monitoring with 1GB of included log storage and all core features
- Get 30GB of log storage with advanced features for $40/month
- Add more storage automatically at $0.46/GB as your needs grow.
Add Scout to Your App
With monitoring that "just works" for Rails, Django and more, get running in minutes with Scout's streamlined setup. No extra code needed - just deploy our agent and start getting insights in 5 minutes.
Get started in under 3 minutes with our easy to install Ruby agent.
Install our gem. In your Gemfile:
gem 'scout_apm'Shell:
bundle installDownload your customized config file, placing it at config/scout_apm.yml.
Deploy.
Get started in under 3 minutes with our easy to install Python agent.
Install the package:
pip install scout-apmConfigure in your settings.py (Django):
# settings.py
INSTALLED_APPS = [
    "scout_apm.django",  # should be listed first
    # ... other apps ...
]

# Scout settings
SCOUT_MONITOR = True
SCOUT_KEY = "[AVAILABLE IN THE SCOUT UI]"
SCOUT_NAME = "A FRIENDLY NAME FOR YOUR APP"
Alternatively, use environment variables: SCOUT_MONITOR, SCOUT_NAME, SCOUT_KEY.
Deploy. Data appears in the Scout UI within approximately 5 minutes.
Get started in under 3 minutes with our easy to install PHP agent.
Install the package:
composer require scoutapp/scout-apm-laravelOptionally install the PHP extension:
sudo pecl install scoutapmConfigure in your .env file and deploy.
Get started in under 3 minutes with our easy to install Elixir agent.
Add to your mix.exs and run mix deps.get:
{:scout_apm, "~> 2.0"}Download your customized config and place it at config/scout_apm.exs.
Add instrumentation to lib/your_app_web.ex:
defmodule YourApp.Web do
  def controller do
    quote do
      use Phoenix.Controller
use ScoutApm.InstrumentationDeploy.
Log Management FAQ
We send a lot of logs – can we limit or filter what we send?
Yes! Scout provides flexible filtering options to control which logs are sent. You can filter by severity level, endpoint, or custom attributes to ensure you're only ingesting the logs that matter most to your debugging workflow.
What languages does Scout Log Management support?
Scout Log Management works with all languages supported by Scout's APM agents, including Ruby, Python, PHP, and Elixir. Logs are collected alongside your performance data for seamless integration.
Can I just use Scout Monitoring for Log Management without enabling the APM agent?
While Log Management works best when paired with Scout's APM agent for full context, you can use it independently for basic log collection and search capabilities.
What happens if I exceed 30GB of data in a single billing cycle?
Additional storage is automatically added at $0.46/GB as your needs grow, so you never have to worry about losing log data. You can monitor your usage in real-time through the Scout dashboard.