Python monitoring to match Python's zen
Python emphasizes readability, simplicity, and the "Pythonic way" -- so we're feeling zen about the fact that Scout offers a monitoring solution that perfectly complements these principles! With support for Django, Flask, FastAPI -- and many other libraries and frameworks -- you're only 3 simple steps from top-tier Python performance insights.
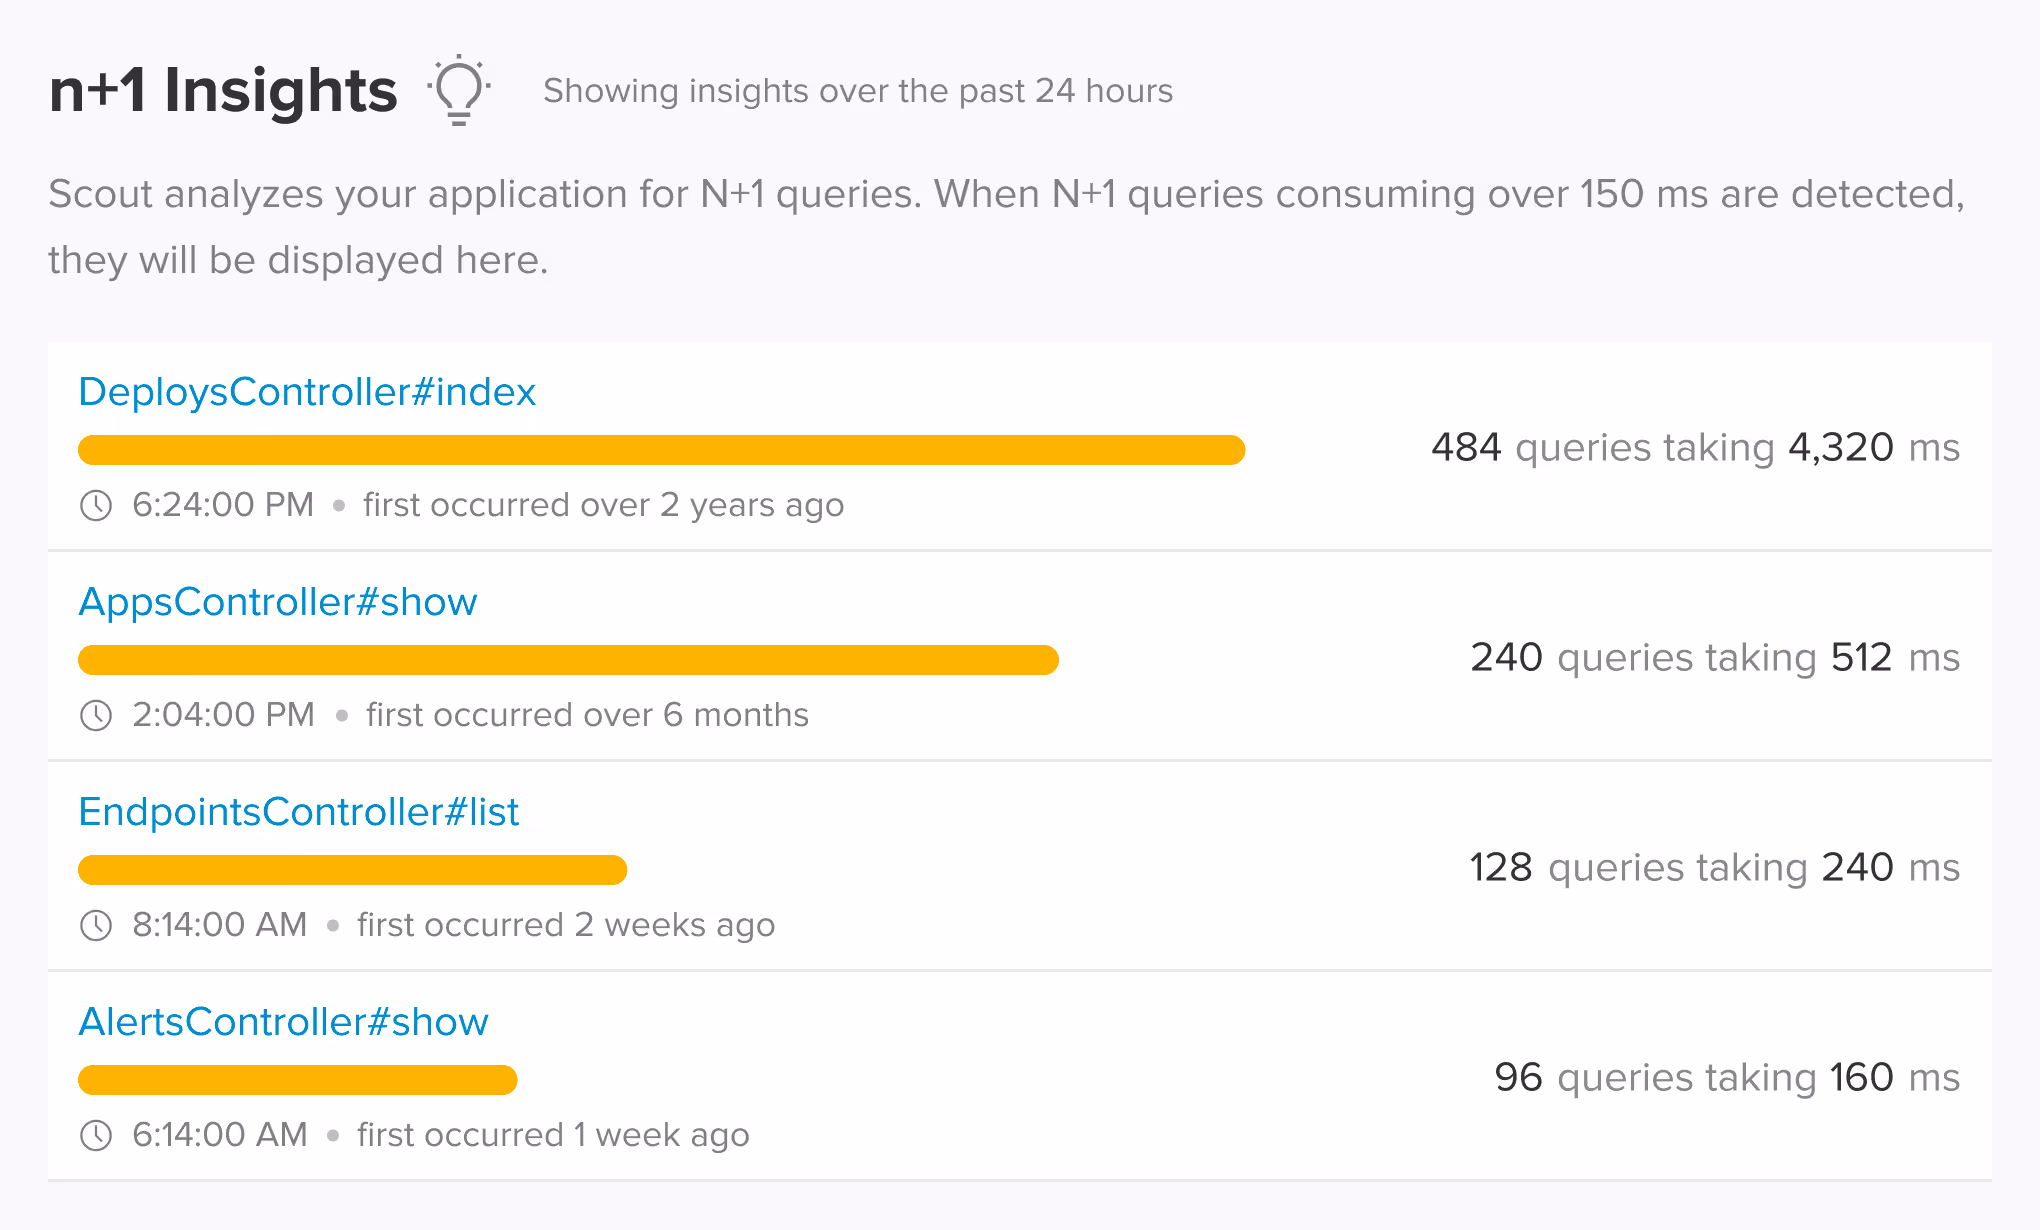
Find Issues Fast
Find and prioritize N+1 queries and memory bloat automatically, ranked by actual impact on your application. Our customers like Grizzly Labs and IETF have seen up to 3x performance improvements by addressing performance and stability issues Scout discovered.
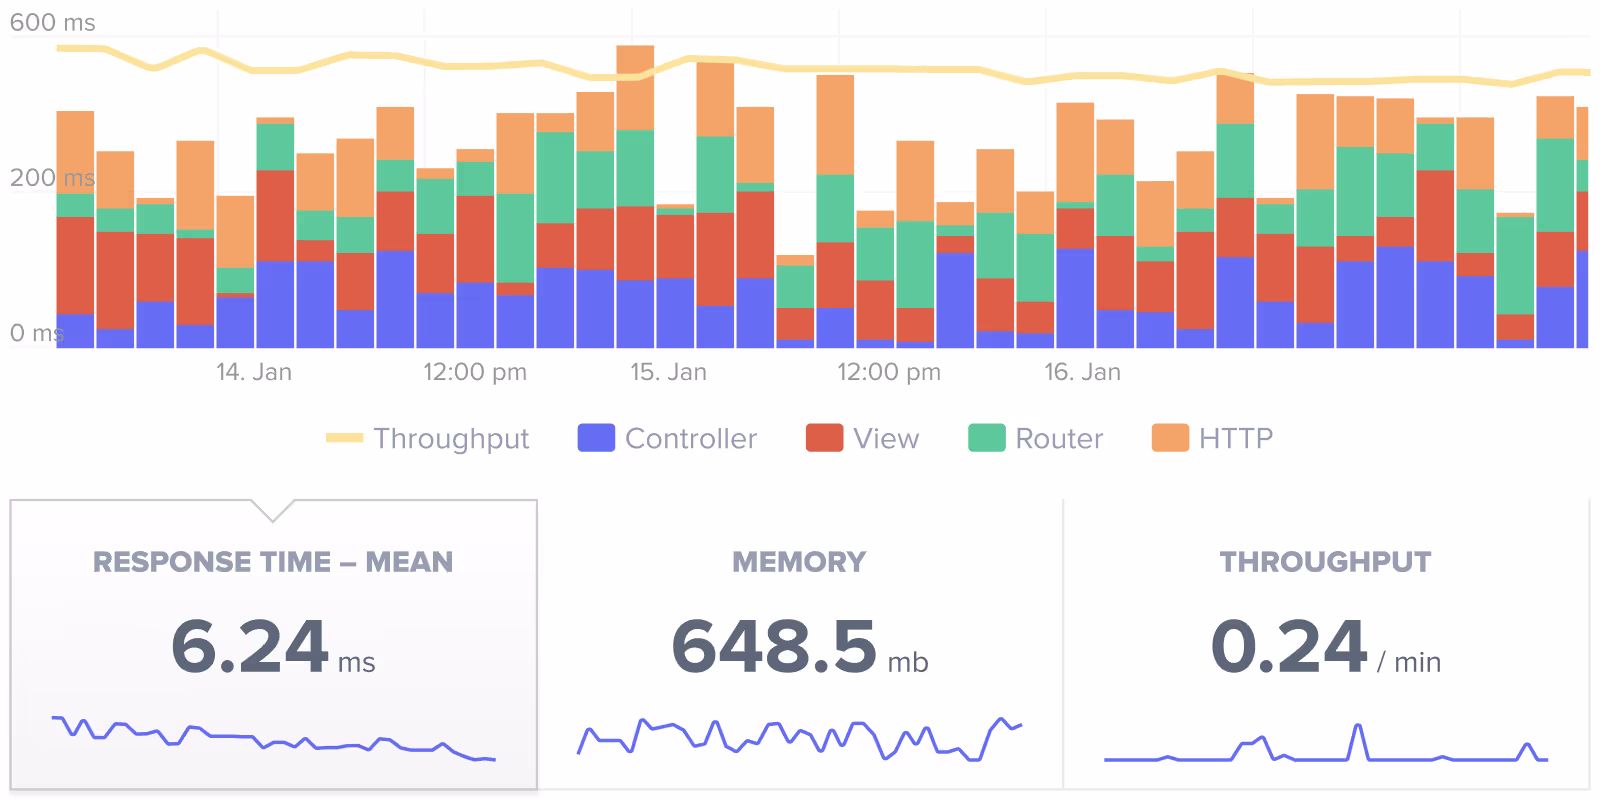
Smart Monitoring
Automatically track memory usage, optimize queries, and monitor object allocations with minimal overhead (typically <1%). Scout analyzes your application metrics every minute and sends them securely through 256-bit encrypted connections, ensuring you never miss a performance regression.
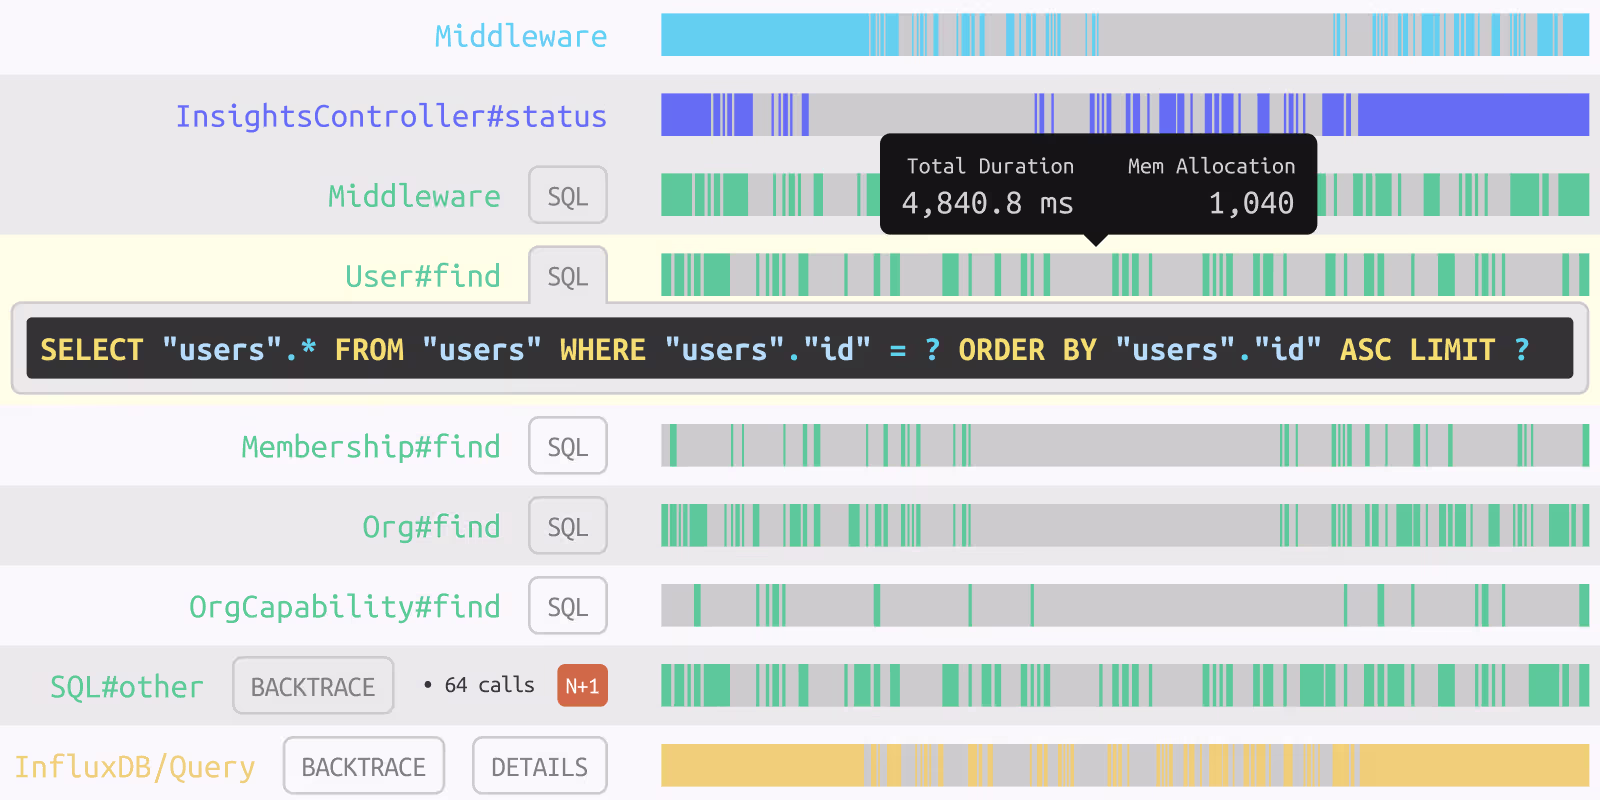
Pinpoint Problems
Trace performance issues directly to the exact line of code, eliminating time wasted searching through logs and stacktraces. Scout's detailed transaction traces show you the whole picture - from controller actions to database queries - with timing breakdowns for each component.
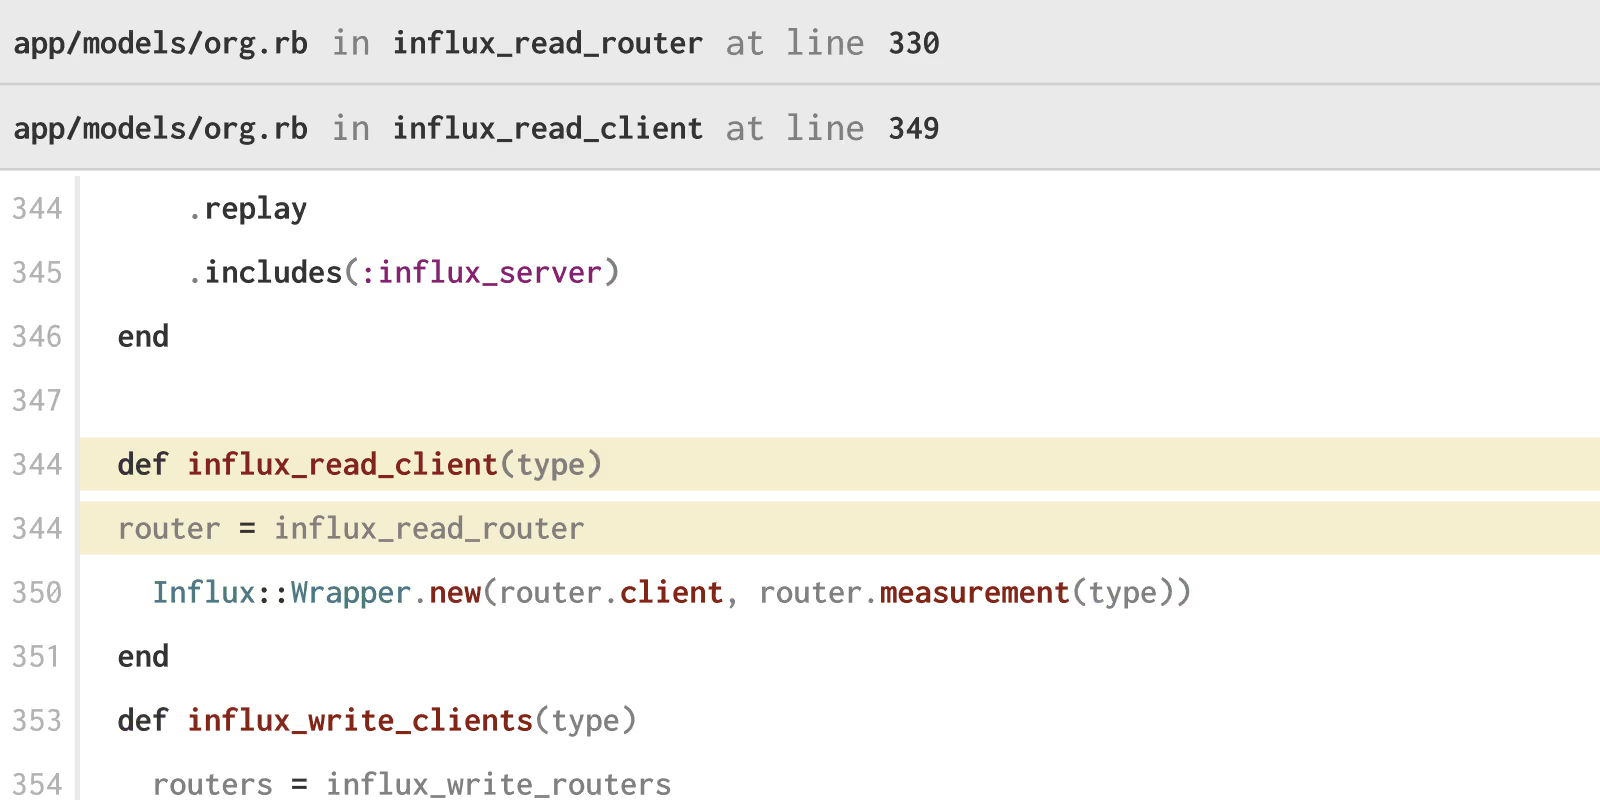
Clear Context
View full context in clear, language-specific syntax, making it easier to understand how problematic code was invoked. Scout's GitHub integration even shows you who wrote the code, when it was deployed, and provides direct links to the relevant source files.
Add Scout to Your Python App
Monitor your Django, Flask, or FastAPI applications with Scout's Python agent. Native logging support and APM features help you track performance across your Python stack.
For Django, use the following steps (Flask and friends, see full docs):
Install the scout-apm package:
pip install scout-apmConfigure Scout in your settings.py file:
INSTALLED_APPS = [
    "scout_apm.django",
]

SCOUT_MONITOR = True
SCOUT_KEY = "[AVAILABLE IN THE SCOUT UI]"
SCOUT_NAME = "A FRIENDLY NAME FOR YOUR APP"If you wish to configure Scout via environment variables, use SCOUT_MONITOR, SCOUT_NAME, and SCOUT_KEY instead of providing these settings in settings.py.
Deploy. It takes approximately five minutes for your data to first appear within the Scout UI.
If you've installed Scout via the Heroku Addon, the provisioning process automatically sets SCOUT_MONITOR and SCOUT_KEY via config vars. Only SCOUT_NAME is additionally required.
Python Monitoring FAQ
What kind of integrations does Scout support?
Scout supports integrations with PagerDuty, Rollbar, Sentry, Zapier, Github, plus others. Click here for a comprehensive list of our integrations.
What's Scout overhead like?
Scout's performance monitoring agent uses just a portion of the resources of existing app monitoring agents while providing higher-fidelity trace details.
What is the Scout Monitoring installation process like?
You can start collecting insights in just 3 easy steps. Simply install your Python framework's package, set a configuration key, and deploy.
What kind of alerting options do I get with Scout Monitoring?
Scout provides alerting options such as Github, Slack, weekly digest emails and more. For a full list visit our alerting options, visit this section of our docs page.
Is it safe to run Scout alongside my current APM library?
Yes