App Traces with Precision and Versatility
Instantly identify performance bottlenecks with detailed transaction monitoring that reveal the full journey of each request, leading directly to the exact line of source code.
Every transaction traced to the line of code
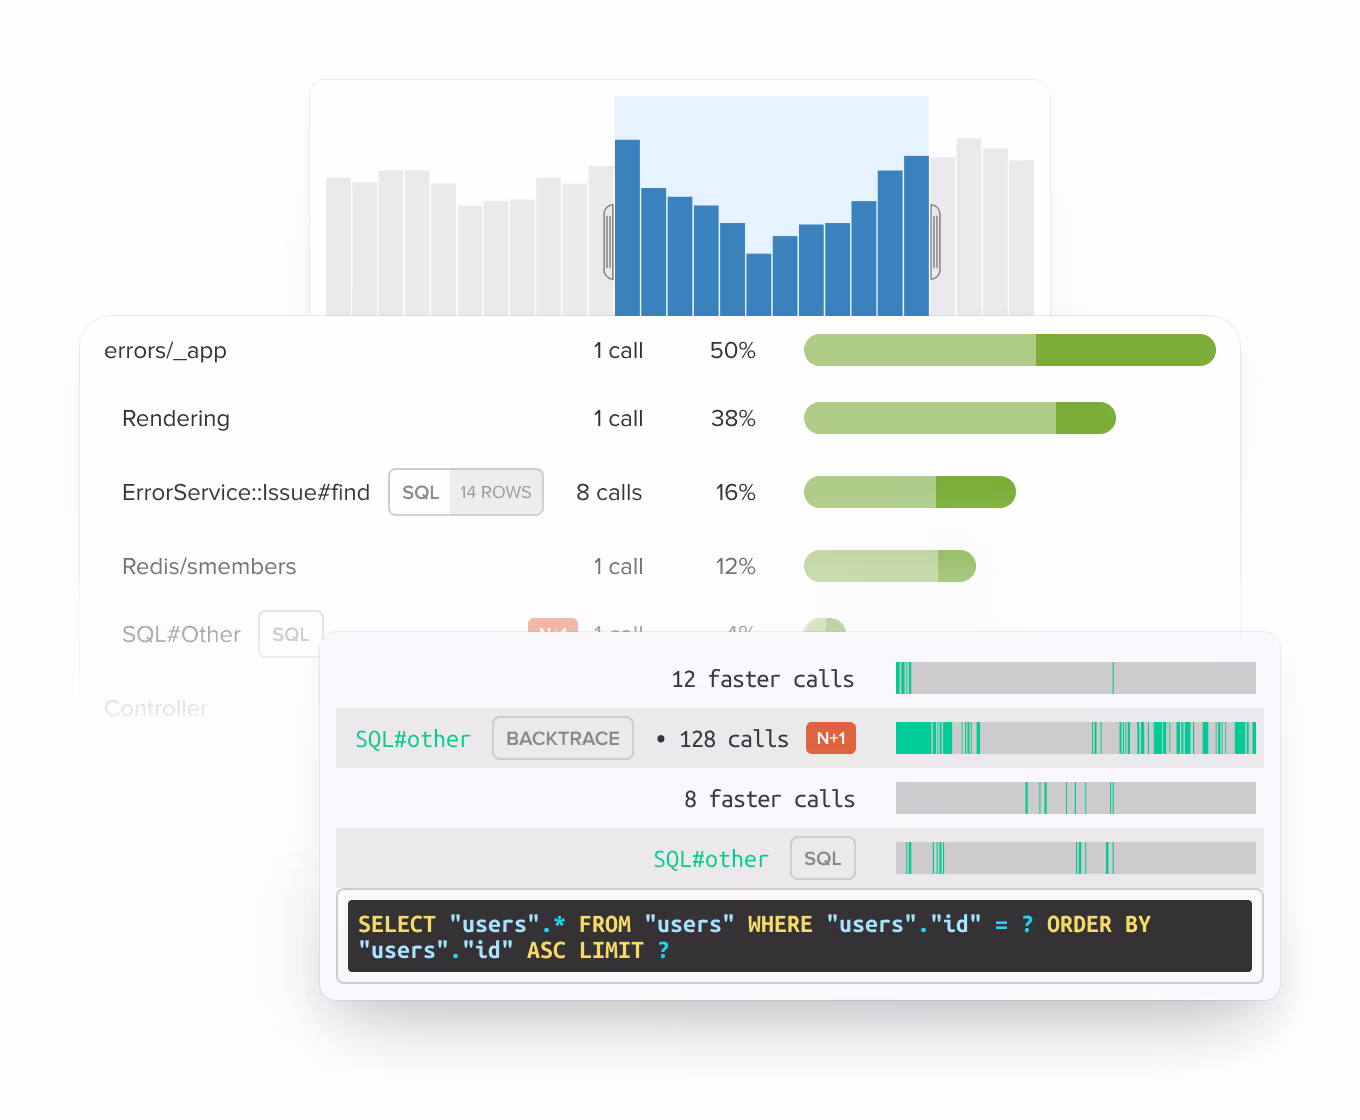
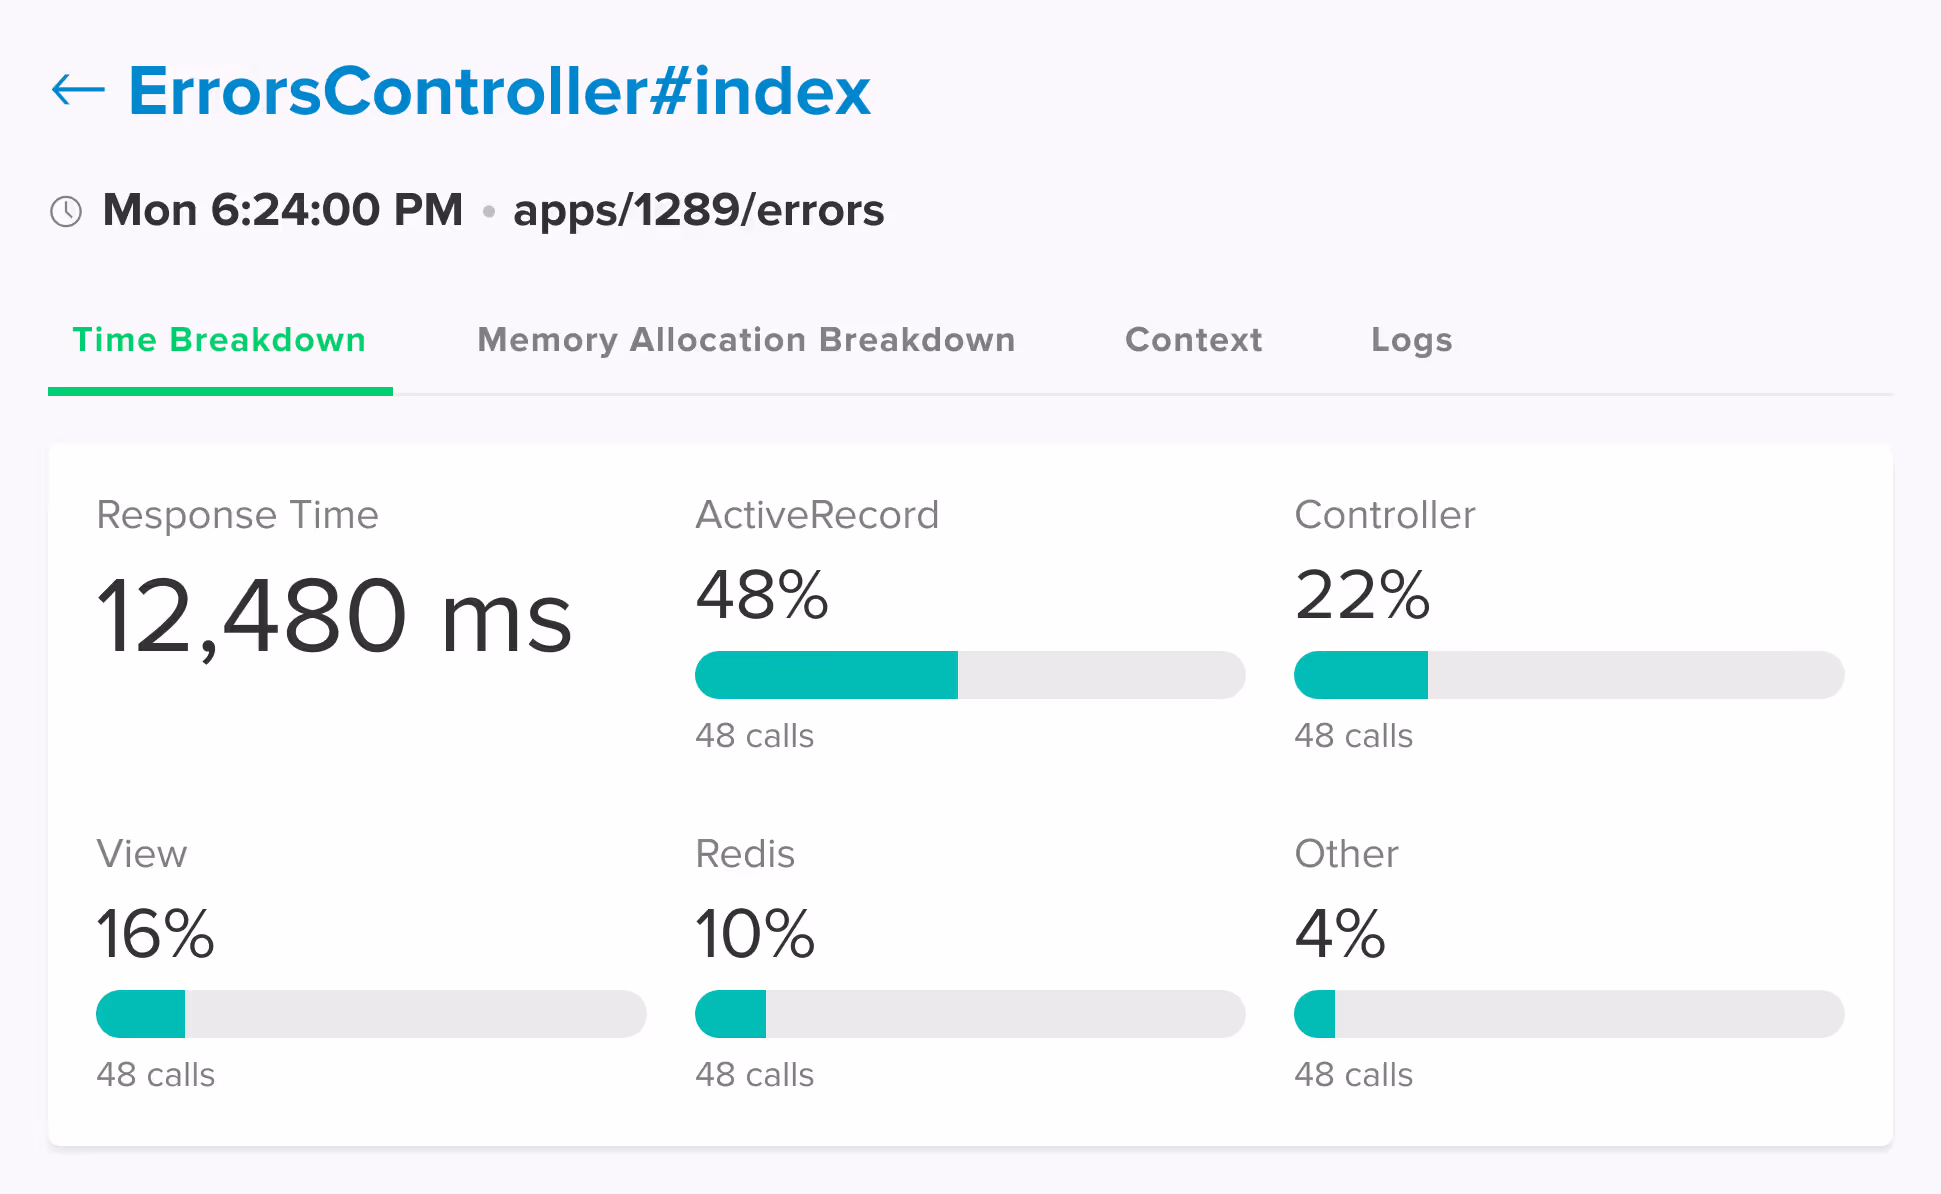
Scout automatically collects and analyzes transactions across your web endpoints and background jobs. Visual indicators highlight performance hotspots, pinpointing issues down to the specific line of code, author, commit date, and deploy time. Add custom context like user IDs or subscription tiers for deeper filtering.
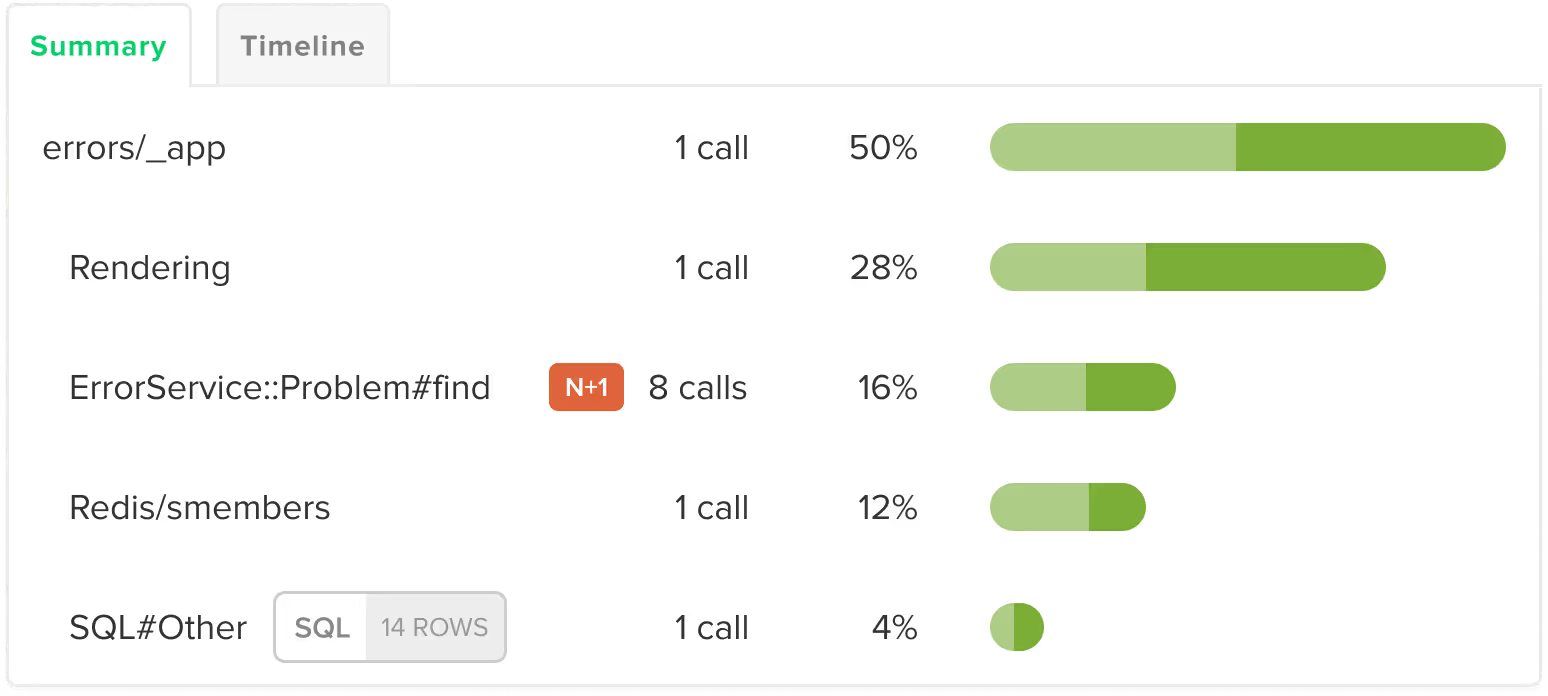
Summary view
Aggregates all identical method calls and ranks by total cost – perfect for quickly identifying your most expensive operations.
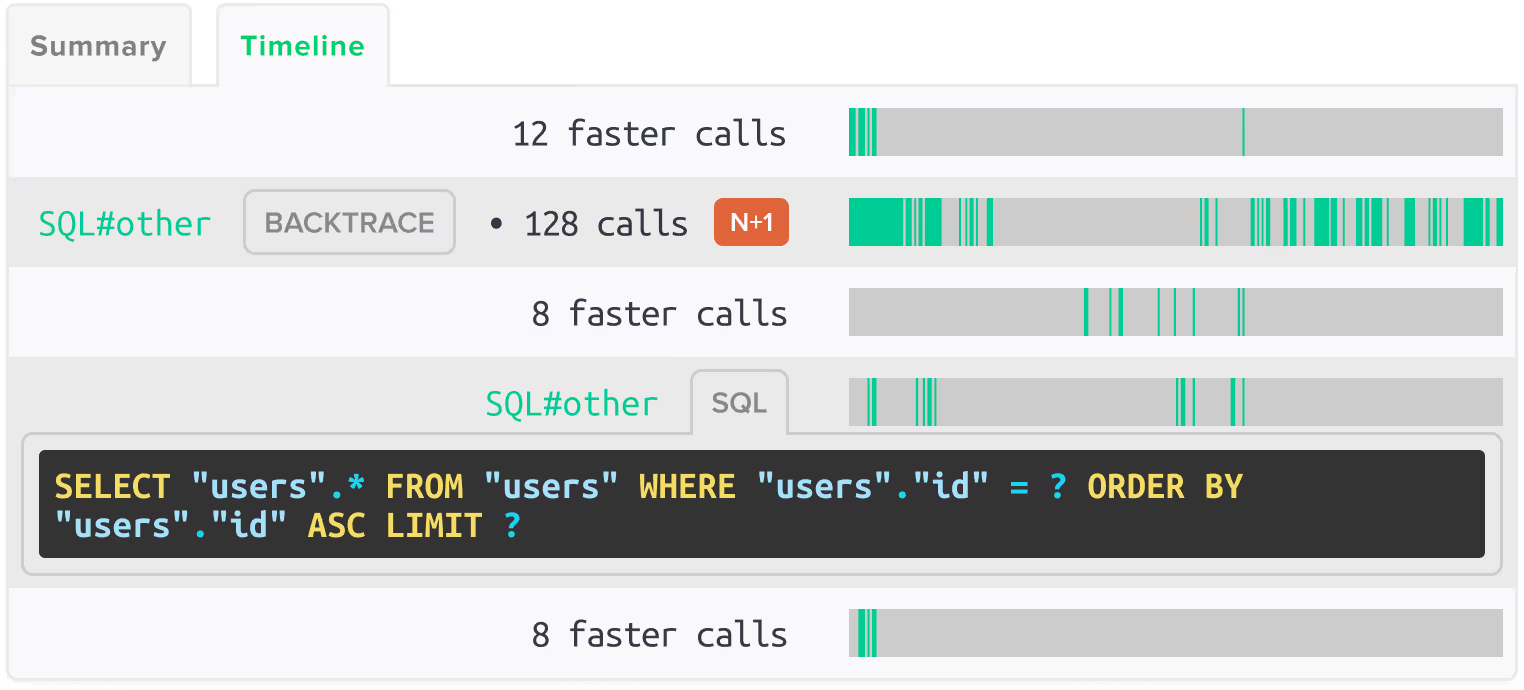
Timeline view
Shows the chronological execution order of every call, letting you see exactly how your code flows during a request – great for identifying issues like N+1 queries or blocking operations that delay other processes.
Find the slow requests that matter
What was the slowest request yesterday? How is the app performing for user X? Which endpoints are generating the bulk of slow requests? The trace explorer answers these in seconds.
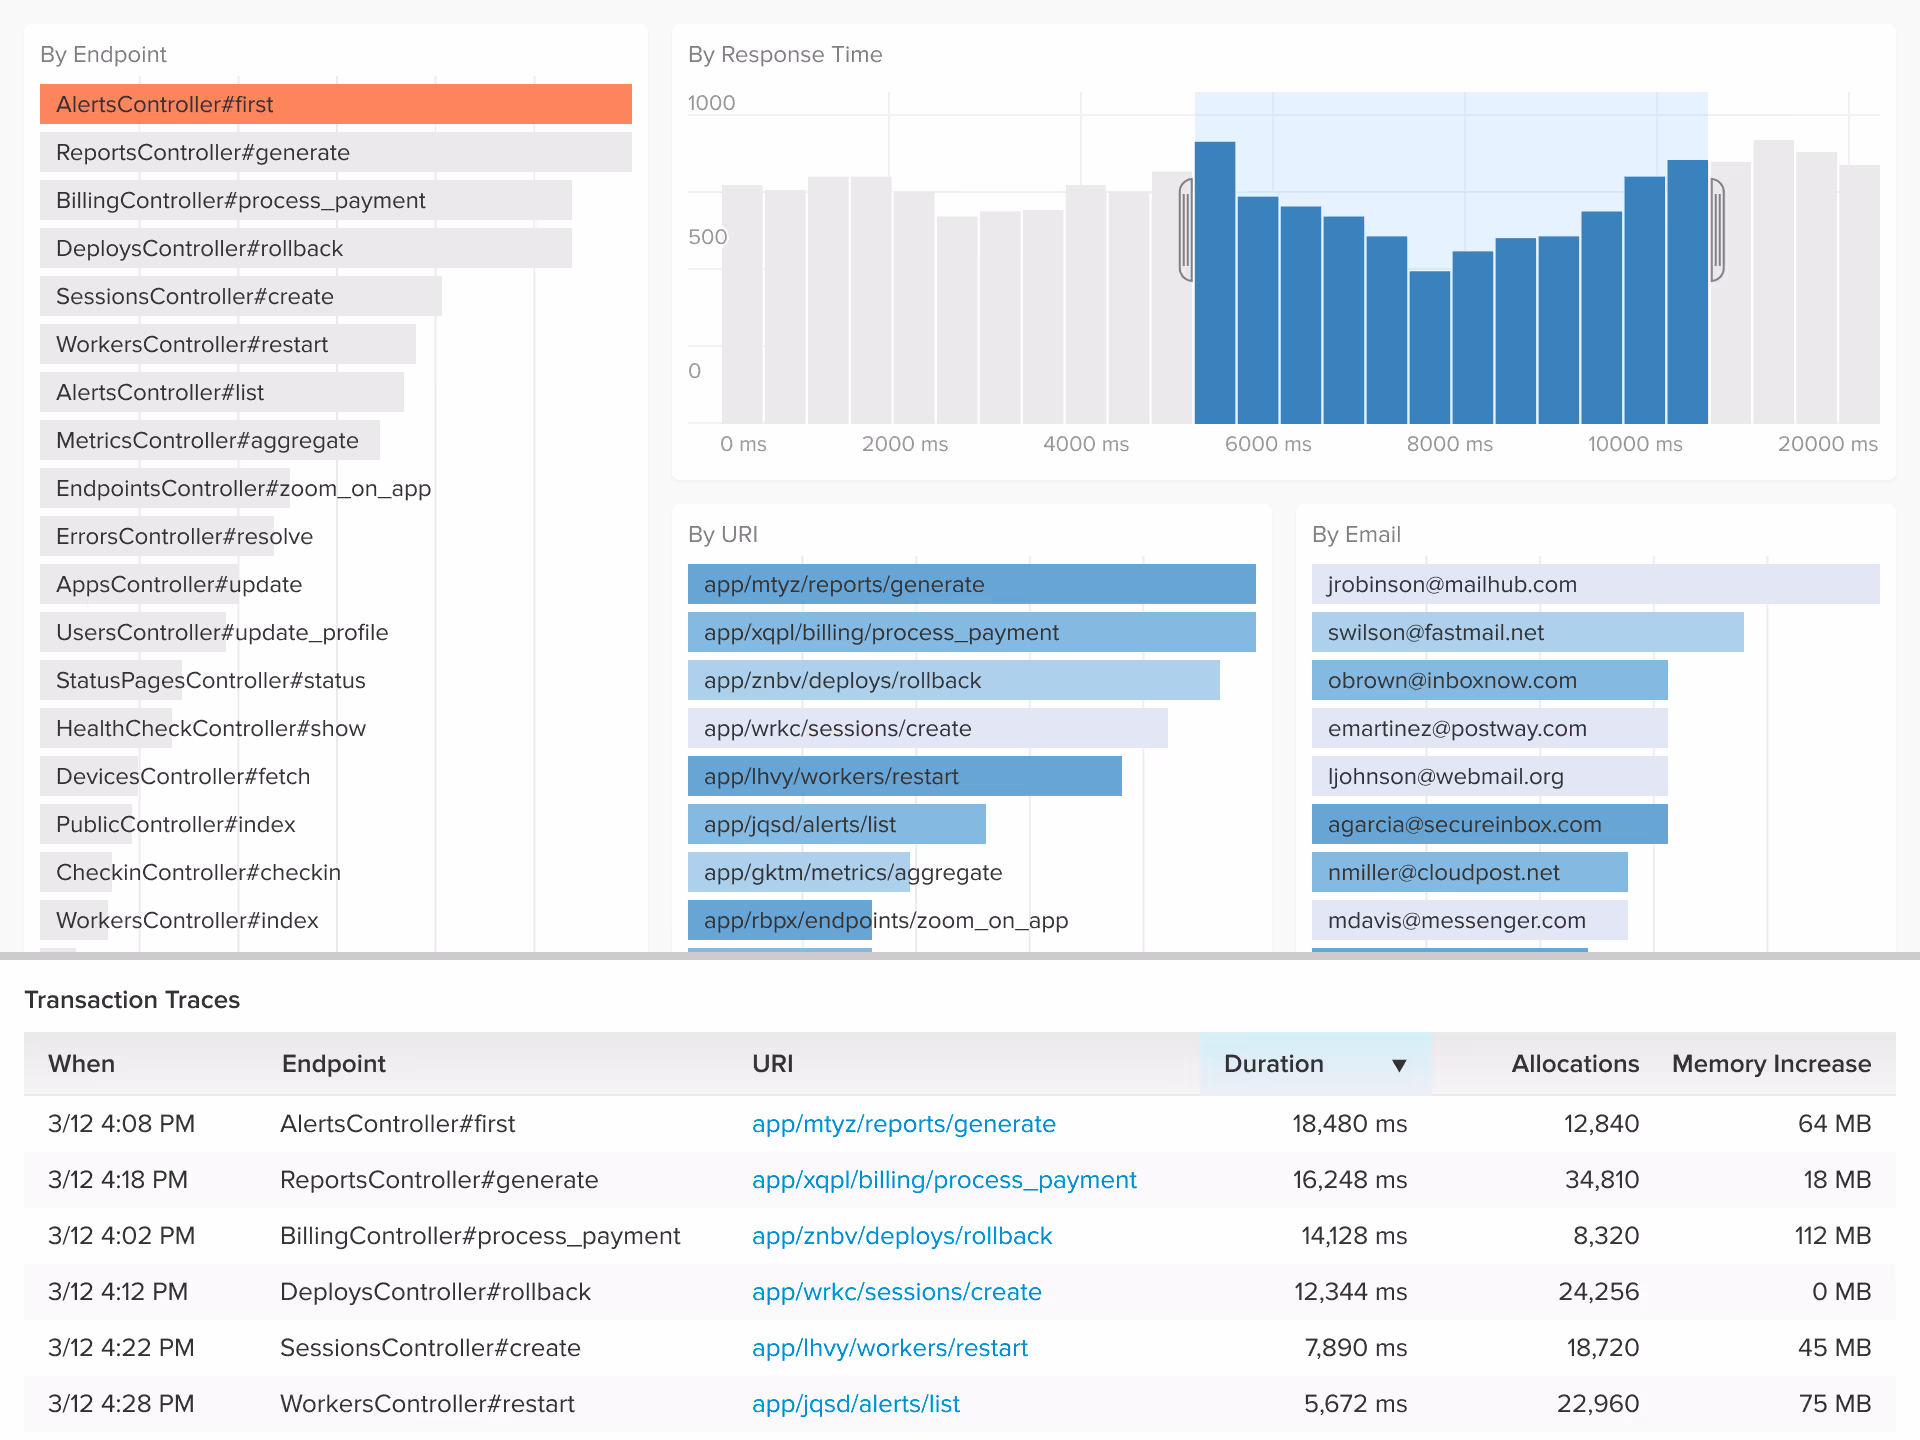
Slowest requests
Identify poorly performing requests to focus your optimization efforts where it matters most.
User analysis
Track and analyze application performance across different users to understand their experience.
Problem endpoints
Spot endpoints generating excessive slow requests and impacting overall performance.
Custom filters
Filter transactions using any custom dimension to drill down into specific scenarios.
Visual insights
Explore and analyze trace metrics through interactive histograms that reveal patterns.
Live updates
Watch filtered trace lists update in real-time as you explore different performance dimensions.
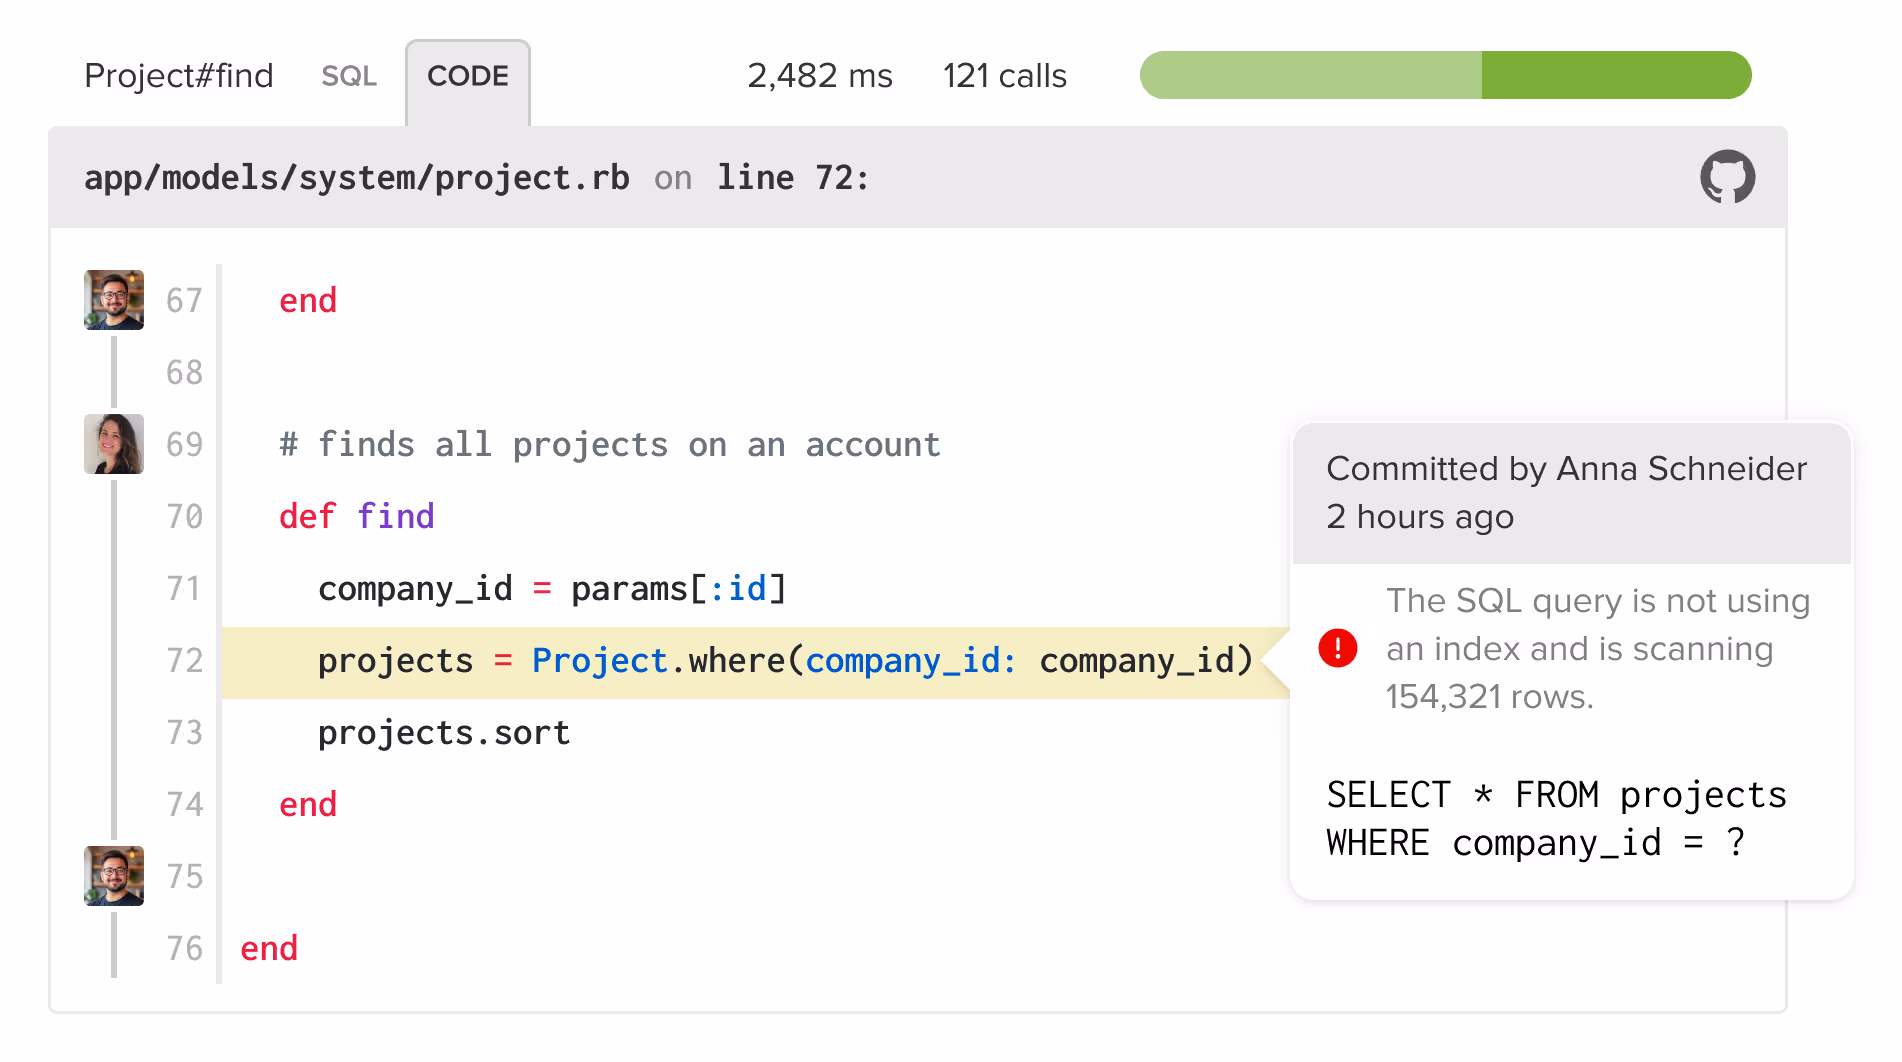
Code Backtraces with GitHub Integration
If you've enabled GitHub integration, you can see the line of code, associated SQL or HTTP endpoint, and the author, commit date, and deployment time for the relevant slow code. If GitHub integration isn't enabled, you'll still see a detailed backtrace.
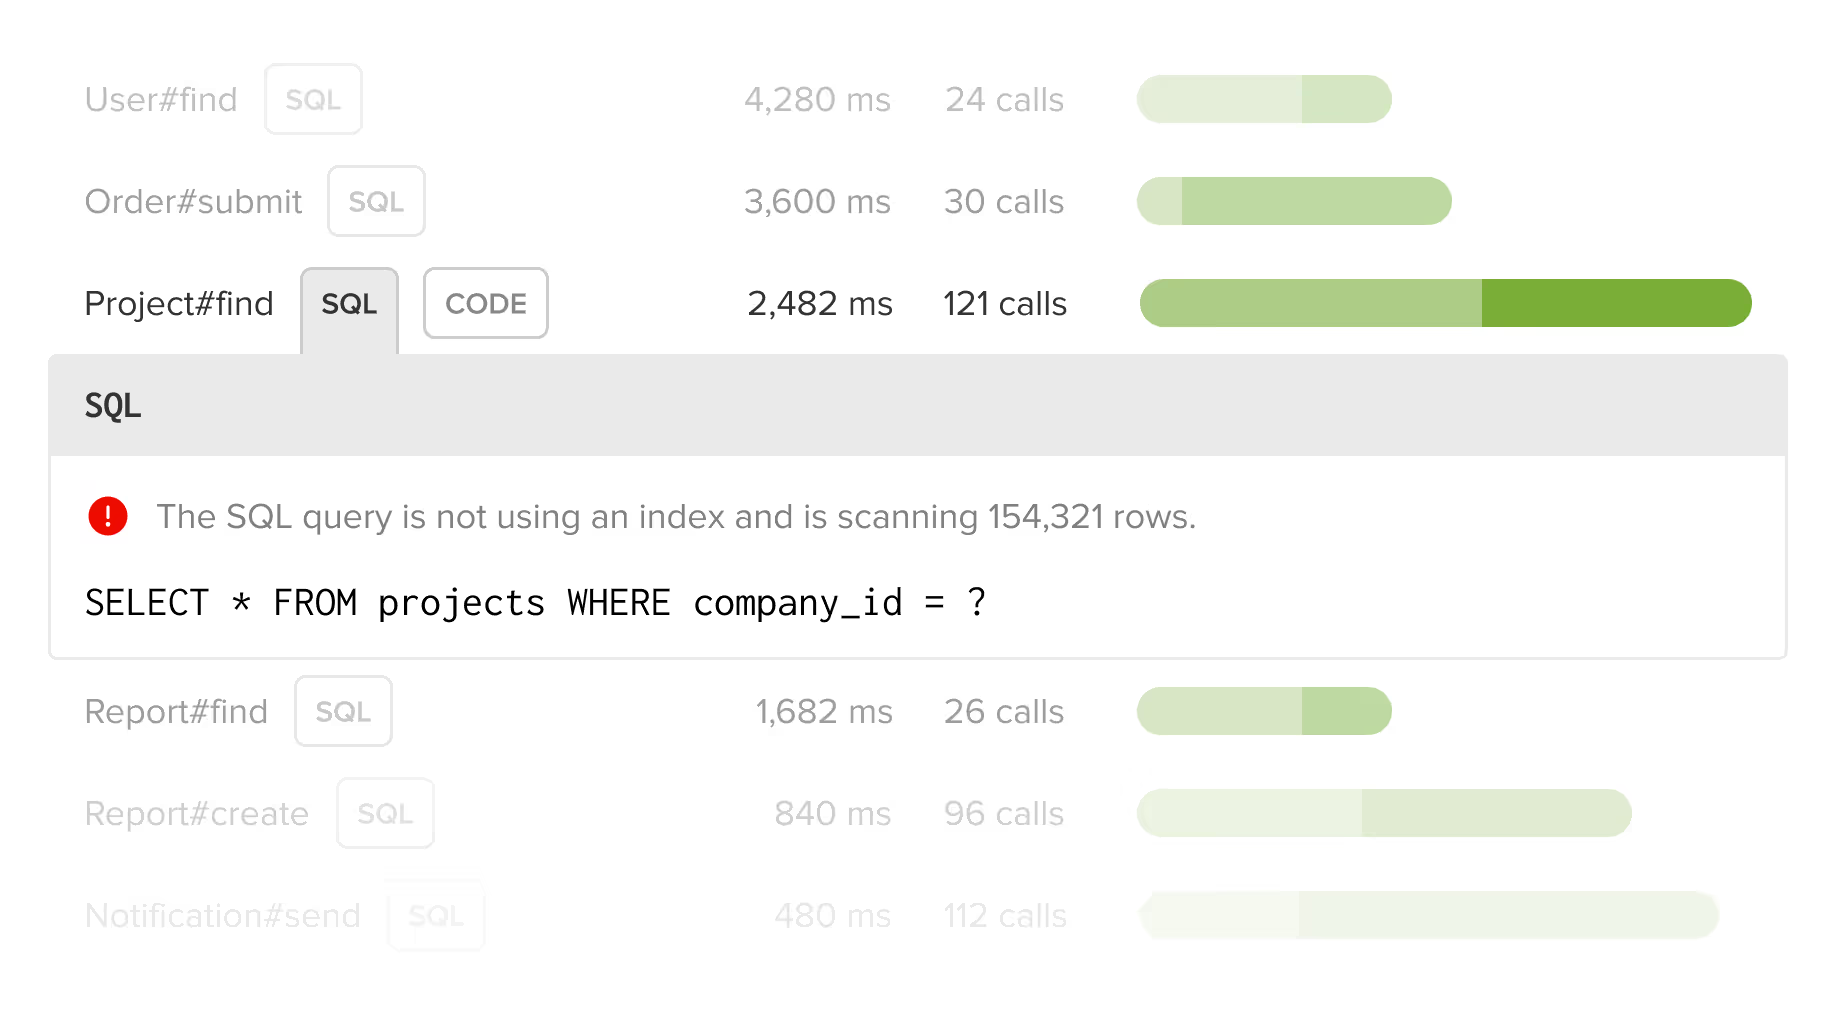
SQL visibility without compromising security
Scout automatically sanitizes and captures SQL queries, so you can track database performance without exposing sensitive data. N+1 problems are annotated inline. Click the "SQL" button next to any call to view complete query details.
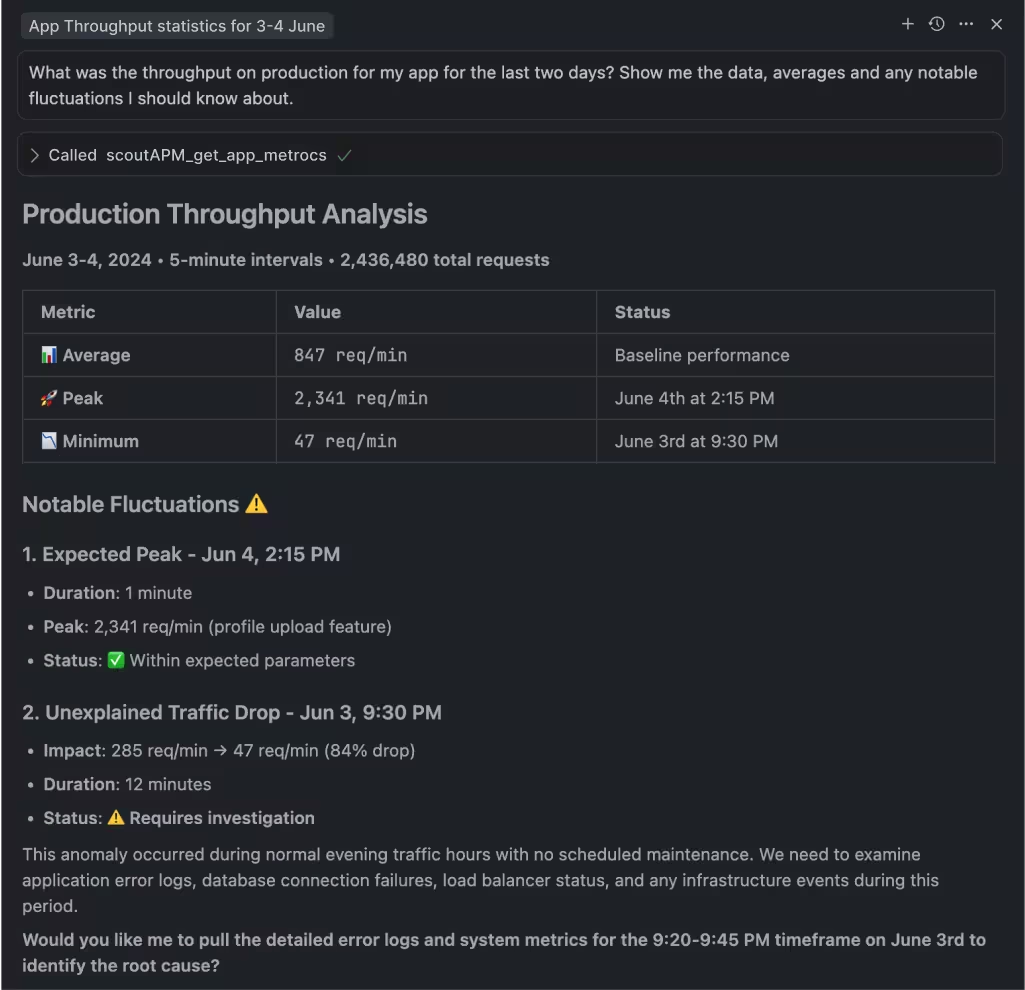
Query traces from your AI coding agent
Scout's MCP server gives Claude Code, Cursor, and other AI coding agents direct access to your trace data. Your agent can list endpoint traces, inspect individual traces with full span detail, and see the code path behind a slow request. When it finds the problem, it already has enough context to suggest a fix.
The Scout CLI provides the same access from your terminal via scout traces with JSON and TOON output formats designed for LLM consumption.
Add Scout to Your App
With monitoring that "just works" for Rails, Django and more, get running in minutes with Scout's streamlined setup. No extra code needed - just deploy our agent and start getting insights in 5 minutes.
Get started in under 3 minutes with our easy to install Ruby agent.
Install our gem. In your Gemfile:
gem 'scout_apm'Shell:
bundle installDownload your customized config file, placing it at config/scout_apm.yml.
Deploy.
Get started in under 3 minutes with our easy to install Python agent.
Install the package:
pip install scout-apmConfigure in your settings.py (Django):
# settings.py
INSTALLED_APPS = [
    "scout_apm.django",  # should be listed first
    # ... other apps ...
]

# Scout settings
SCOUT_MONITOR = True
SCOUT_KEY = "[AVAILABLE IN THE SCOUT UI]"
SCOUT_NAME = "A FRIENDLY NAME FOR YOUR APP"
Alternatively, use environment variables: SCOUT_MONITOR, SCOUT_NAME, SCOUT_KEY.
Deploy. Data appears in the Scout UI within approximately 5 minutes.
Get started in under 3 minutes with our easy to install PHP agent.
Install the package:
composer require scoutapp/scout-apm-laravelOptionally install the PHP extension:
sudo pecl install scoutapmConfigure in your .env file and deploy.
Get started in under 3 minutes with our easy to install Elixir agent.
Add to your mix.exs and run mix deps.get:
{:scout_apm, "~> 2.0"}Download your customized config and place it at config/scout_apm.exs.
Add instrumentation to lib/your_app_web.ex:
defmodule YourApp.Web do
  def controller do
    quote do
      use Phoenix.Controller
use ScoutApm.InstrumentationDeploy.
Get started in under 5 minutes with our Node.js agent.
Install the package:
npm install @scout_apm/scout-apmCreate scout.js with your app name and key. Require it first in your entry point, before other packages.
Add middleware: Express uses expressMiddleware() and errorMiddleware(). NestJS uses nestMiddleware() and nestErrorFilter().
Deploy. Data appears in Scout within 5 minutes.
App Traces FAQ
What languages does Scout tracing support?
Scout tracing is available for Ruby (Rails, Sinatra, Grape, Sidekiq, Resque, and more), Python (Django, Flask, FastAPI, Celery), Node.js (Express, NestJS, Prisma), PHP (Laravel, Symfony), and Elixir (Phoenix, LiveView, Oban). All languages include automatic instrumentation with code-level visibility.
Can I query traces from Claude Code, Cursor, or other AI coding agents?
Yes. Scout's MCP server includes tools for listing endpoint traces and inspecting individual traces with full span detail. Your AI coding agent can query which endpoints are slowest, pull a specific trace, and see the exact code path and query timing. The Scout CLI provides the same access via scout traces with JSON and TOON output for LLM consumption.
Does Scout detect N+1 queries automatically?
Yes. Scout identifies repeated query patterns within a trace without configuration. It flags the code location, query count, and time impact. This works for ActiveRecord (Rails), Django ORM, Eloquent (Laravel), Ecto (Elixir), and Prisma (Node.js).
How does Scout tracing compare to Datadog or New Relic?
Scout focuses on code-level application traces rather than infrastructure-wide distributed tracing. You see the exact line of code, the author, and the deploy behind every slow request. Datadog and New Relic offer broader infrastructure tracing but with less depth at the application code level. Scout also provides trace data via MCP server and CLI for AI-assisted development workflows.