Error Monitoring
Track exceptions with full context alongside your performance data. Scout's error monitoring gives you the complete picture when things go wrong.
Errors alongside your traces and performance data
Scout puts errors next to the traces and metrics that caused them. Intelligent grouping and automatic context capture give you the error data you need without switching tools. See the slow query behind the timeout behind the exception, all in one place.

Capture request parameters and custom context from our Agent
Automatically collect request parameters, session data, and custom context to get the full picture of what was happening when the error occurred.
Group errors intelligently by location and type
Smart grouping prevents error spam and focuses on unique issues, organizing by stack trace similarity and occurrence location.
Notify your dev teams via email, Slack, and more
Instant notifications when new errors occur or existing ones spike, with flexible rules based on severity and frequency.
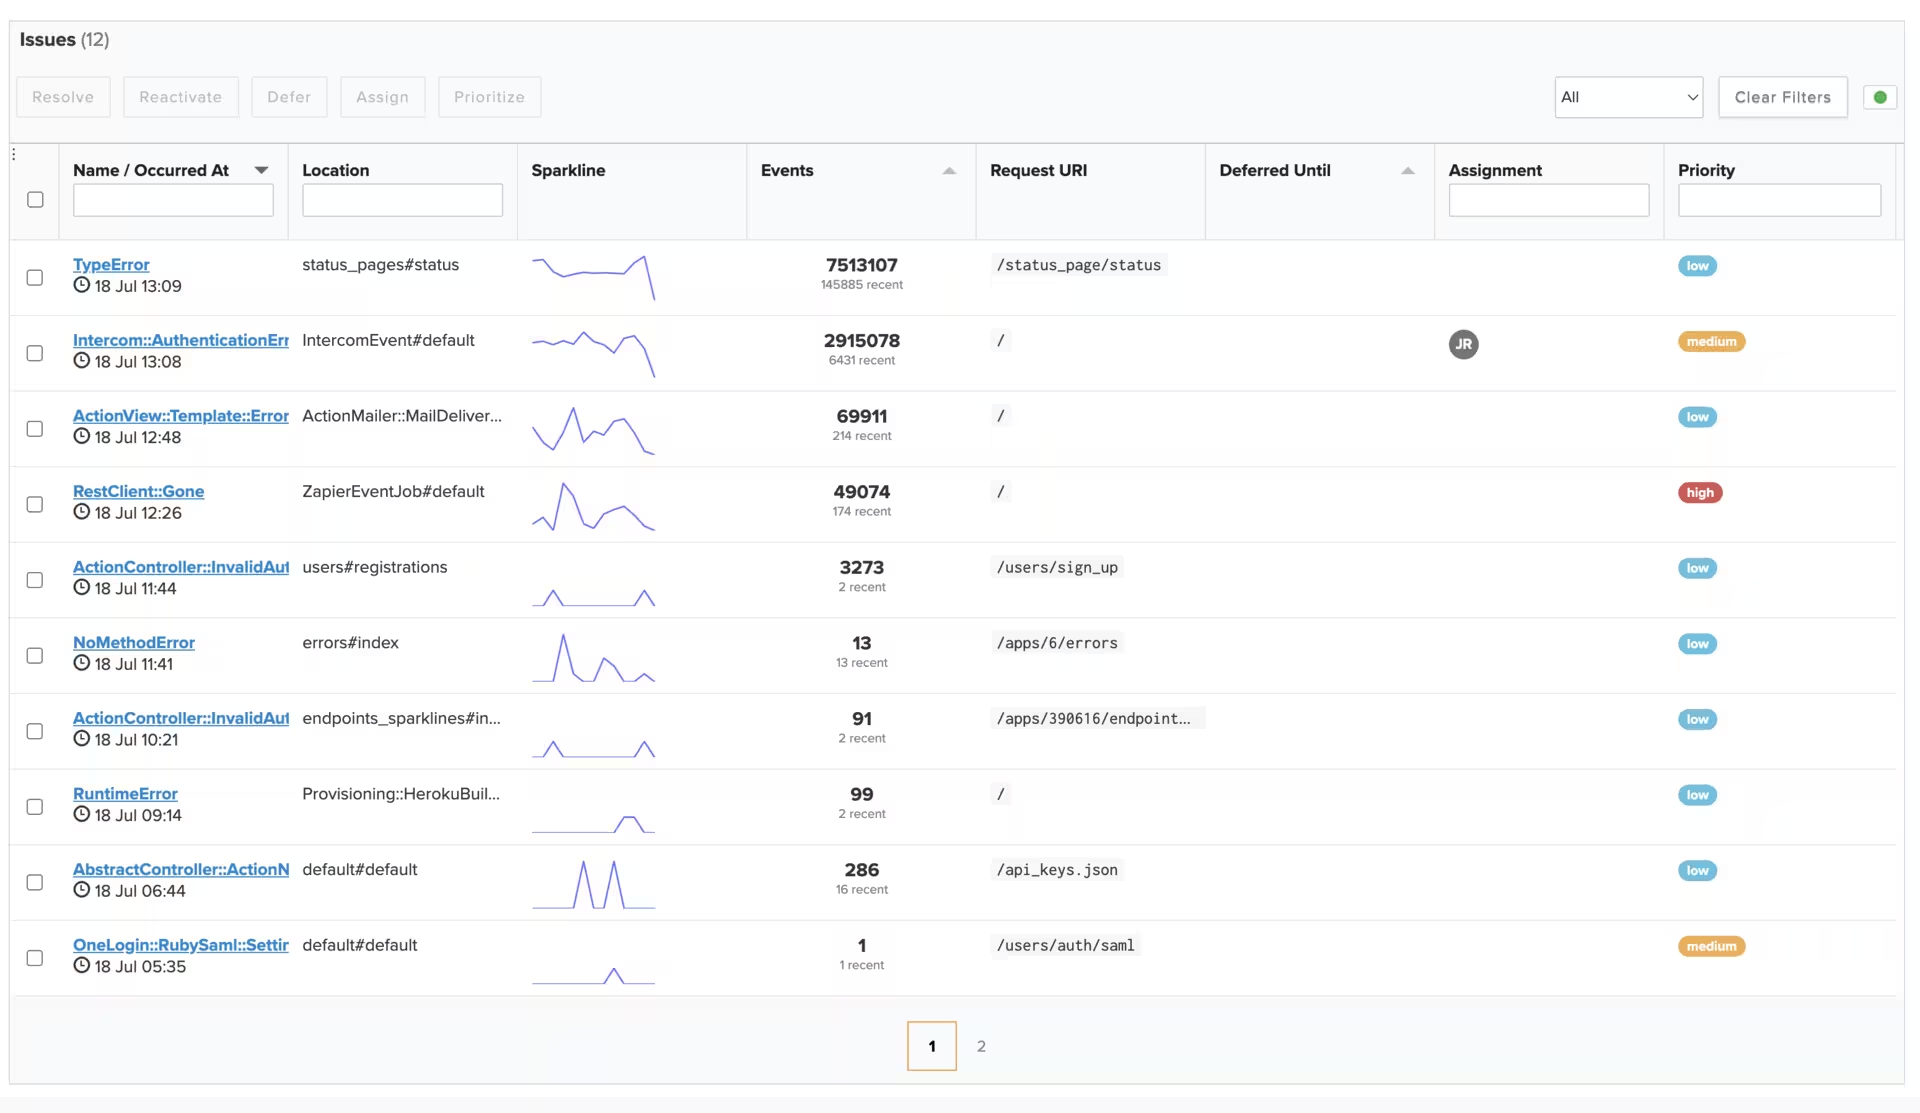
Triage effectively – assign, manage notifications, and prioritize
Assign errors to team members, set status, and manage notification preferences for better organization and accountability.
Smart Error Detection and Filtering
Find exactly what you need, when you need it. Our intelligent error detection and filtering approach lets you efficiently manage thousands of errors without getting overwhelmed, with the specific features you need:
Endpoint tagging
Tag critical endpoints to prioritize errors automatically.
GitHub Integration
Fix fast with stack traces and GitHub integration for deeper info.
Quick Identification
Instantly locate and filter errors by specific controller actions and endpoints for focused debugging.
Pre-load Data
Narrow your search parameters before loading data to efficiently explore large error volumes.
Real-time Filtering
Filter loaded errors in real-time using powerful search patterns to find exact matches.
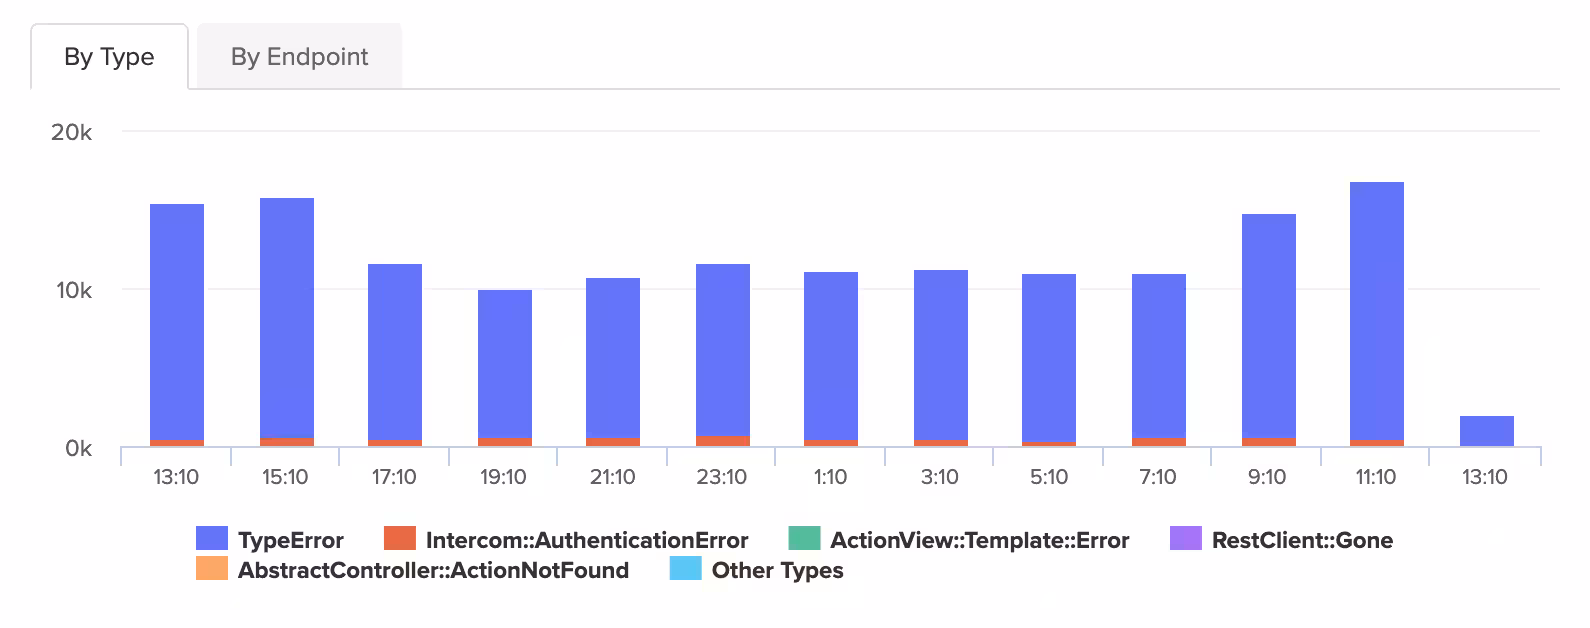
Error Trends
Monitor error trends with clear indicators showing error frequency and impact over time.
Error Data Organization and Retention
Scout keeps your error data organized and accessible. Track error patterns with real-time error tracking and trend analysis. Monitor both error frequency and resolution rates to stay on top of application health. All error data is retained for 30 days, with severity level filtering to help you focus on what matters.
Pricing that Makes Sense
Straightforward and transparent pricing means you can worry about your application, not your bill. Start with our free tier to get started monitoring your applications.
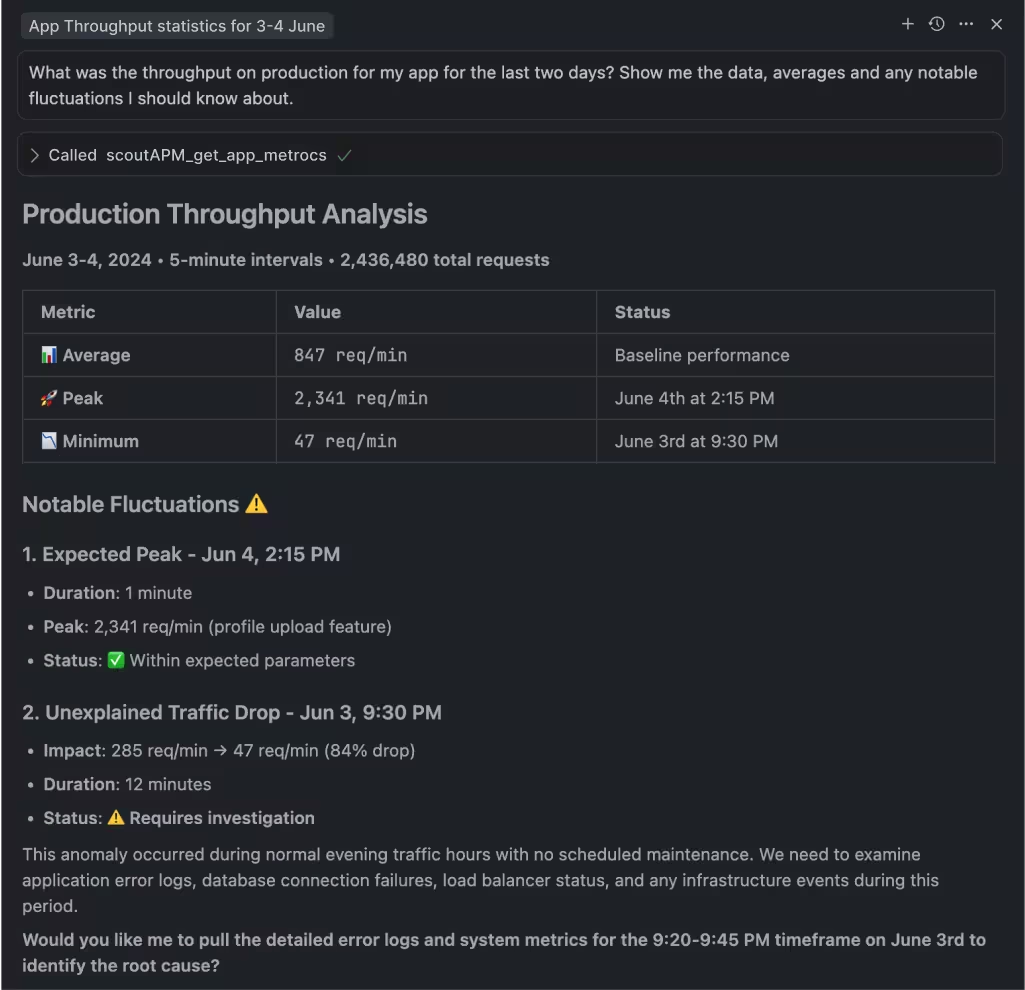
Debug Errors from Your AI Coding Agent
Your AI coding agent can read your production errors directly. Scout's MCP server gives Claude Code, Cursor, and other MCP-compatible tools access to error groups and stack traces. When your agent finds a bug, it already has the production context to suggest a fix.
The Scout CLI provides the same error data from your terminal, with JSON and TOON output formats designed for LLM consumption. Pipe error details into any AI tool, or use the public API for custom integrations.
Add Scout to Your App
With monitoring that "just works" for Rails, Django and more, get running in minutes with Scout's streamlined setup. No extra code needed - just deploy our agent and start getting insights in 5 minutes.
Get started in under 3 minutes with our easy to install Ruby agent.
Install our gem. In your Gemfile:
gem 'scout_apm'Shell:
bundle installDownload your customized config file, placing it at config/scout_apm.yml.
Deploy.
Get started in under 3 minutes with our easy to install Python agent.
Install the package:
pip install scout-apmConfigure in your settings.py (Django):
# settings.py
INSTALLED_APPS = [
    "scout_apm.django",  # should be listed first
    # ... other apps ...
]

# Scout settings
SCOUT_MONITOR = True
SCOUT_KEY = "[AVAILABLE IN THE SCOUT UI]"
SCOUT_NAME = "A FRIENDLY NAME FOR YOUR APP"
Alternatively, use environment variables: SCOUT_MONITOR, SCOUT_NAME, SCOUT_KEY.
Deploy. Data appears in the Scout UI within approximately 5 minutes.
Get started in under 3 minutes with our easy to install PHP agent.
Install the package:
composer require scoutapp/scout-apm-laravelOptionally install the PHP extension:
sudo pecl install scoutapmConfigure in your .env file and deploy.
Get started in under 3 minutes with our easy to install Elixir agent.
Add to your mix.exs and run mix deps.get:
{:scout_apm, "~> 2.0"}Download your customized config and place it at config/scout_apm.exs.
Add instrumentation to lib/your_app_web.ex:
defmodule YourApp.Web do
  def controller do
    quote do
      use Phoenix.Controller
use ScoutApm.InstrumentationDeploy.
Get started in under 5 minutes with our Node.js agent.
Install the package:
npm install @scout_apm/scout-apmCreate scout.js with your app name and key. Require it first in your entry point, before other packages.
Add middleware: Express uses expressMiddleware() and errorMiddleware(). NestJS uses nestMiddleware() and nestErrorFilter().
Deploy. Data appears in Scout within 5 minutes.
Error Monitoring FAQ
Can I use Scout Error Monitoring as a standalone product?
Error Monitoring works best when paired with Scout's APM for full context, but it can be used independently for basic error tracking and notification capabilities.
What languages are supported?
Scout Error Monitoring is available for Ruby, Python, Node.js (Express and NestJS), PHP (Laravel and Symfony), and Elixir (Phoenix). Uncaught exceptions are captured automatically with full stack traces. PHP also supports manual capture for caught exceptions via the agent API.
Can I track custom errors?
Yes. Scout allows you to capture custom errors and exceptions using the agent API, giving you full control over what gets tracked.
Can I query Scout errors from Claude Code, Cursor, or other AI coding agents?
Yes. Scout offers hosted and local MCP servers that give AI coding agents direct access to your error data. You can query error groups and view stack traces from Claude Code, Cursor, or any MCP-compatible assistant. The Scout CLI provides error listing, detail, and occurrence commands with JSON and TOON output formats designed for LLM consumption. There is also a public API for custom integrations.
How does Scout error monitoring compare to Sentry?
Sentry is an error-first tool. Scout is an APM-first tool with integrated error monitoring. With Scout, your errors live alongside traces, performance metrics, and N+1 query detection in a single tool. You see the slow database query that caused the timeout that caused the exception, all in one place. Sentry requires a separate APM product for that context. Both Scout and Sentry offer MCP servers for AI-assisted development. Scout's MCP also covers traces, performance metrics, and N+1 insights alongside errors, while Scout's CLI provides terminal access with TOON format output designed for LLM workflows.