SQLAlchemy Performance Monitoring
N+1 detection, query performance tracing, and slow query identification for your SQLAlchemy-backed Python applications. Scout's Python agent instruments SQLAlchemy automatically. Supports SQLite, PostgreSQL, MySQL, MariaDB, Oracle, MS SQL, and CockroachDB.
SQLAlchemy Query Performance in the Context of Every Request
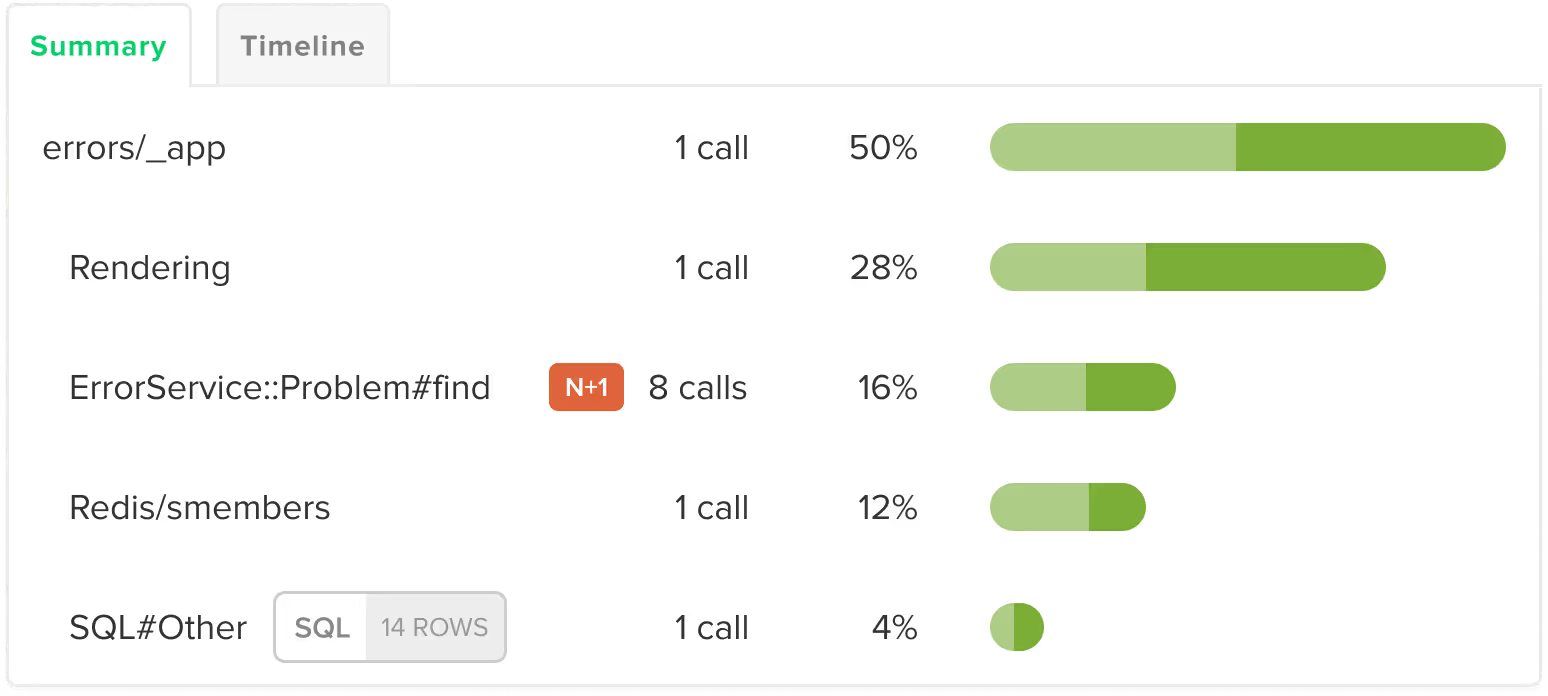
Scout connects SQLAlchemy query timing to the full transaction trace for every Flask route, FastAPI endpoint, and Celery task. When a query is slow or a N+1 pattern fires, you see it in context alongside the surrounding log lines.
Error Monitoring
Database errors from SQLAlchemy queries are captured and linked to the originating transaction trace. Whether a query times out, a constraint fails, or a connection is exhausted, the error appears with the full trace context.
Log Management
Log output is enriched with trace context. Filter logs by trace ID to see the full sequence of SQLAlchemy queries made during a specific request or task execution.
App Traces
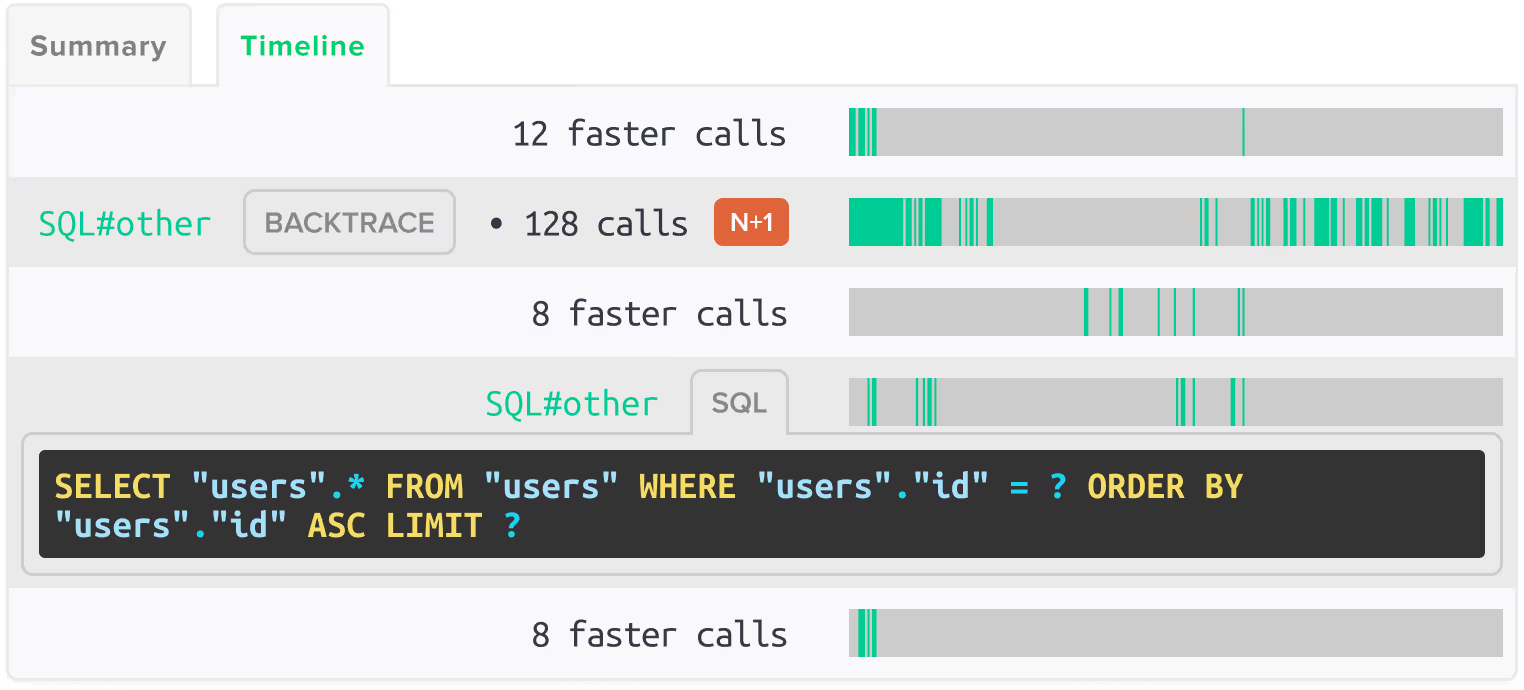
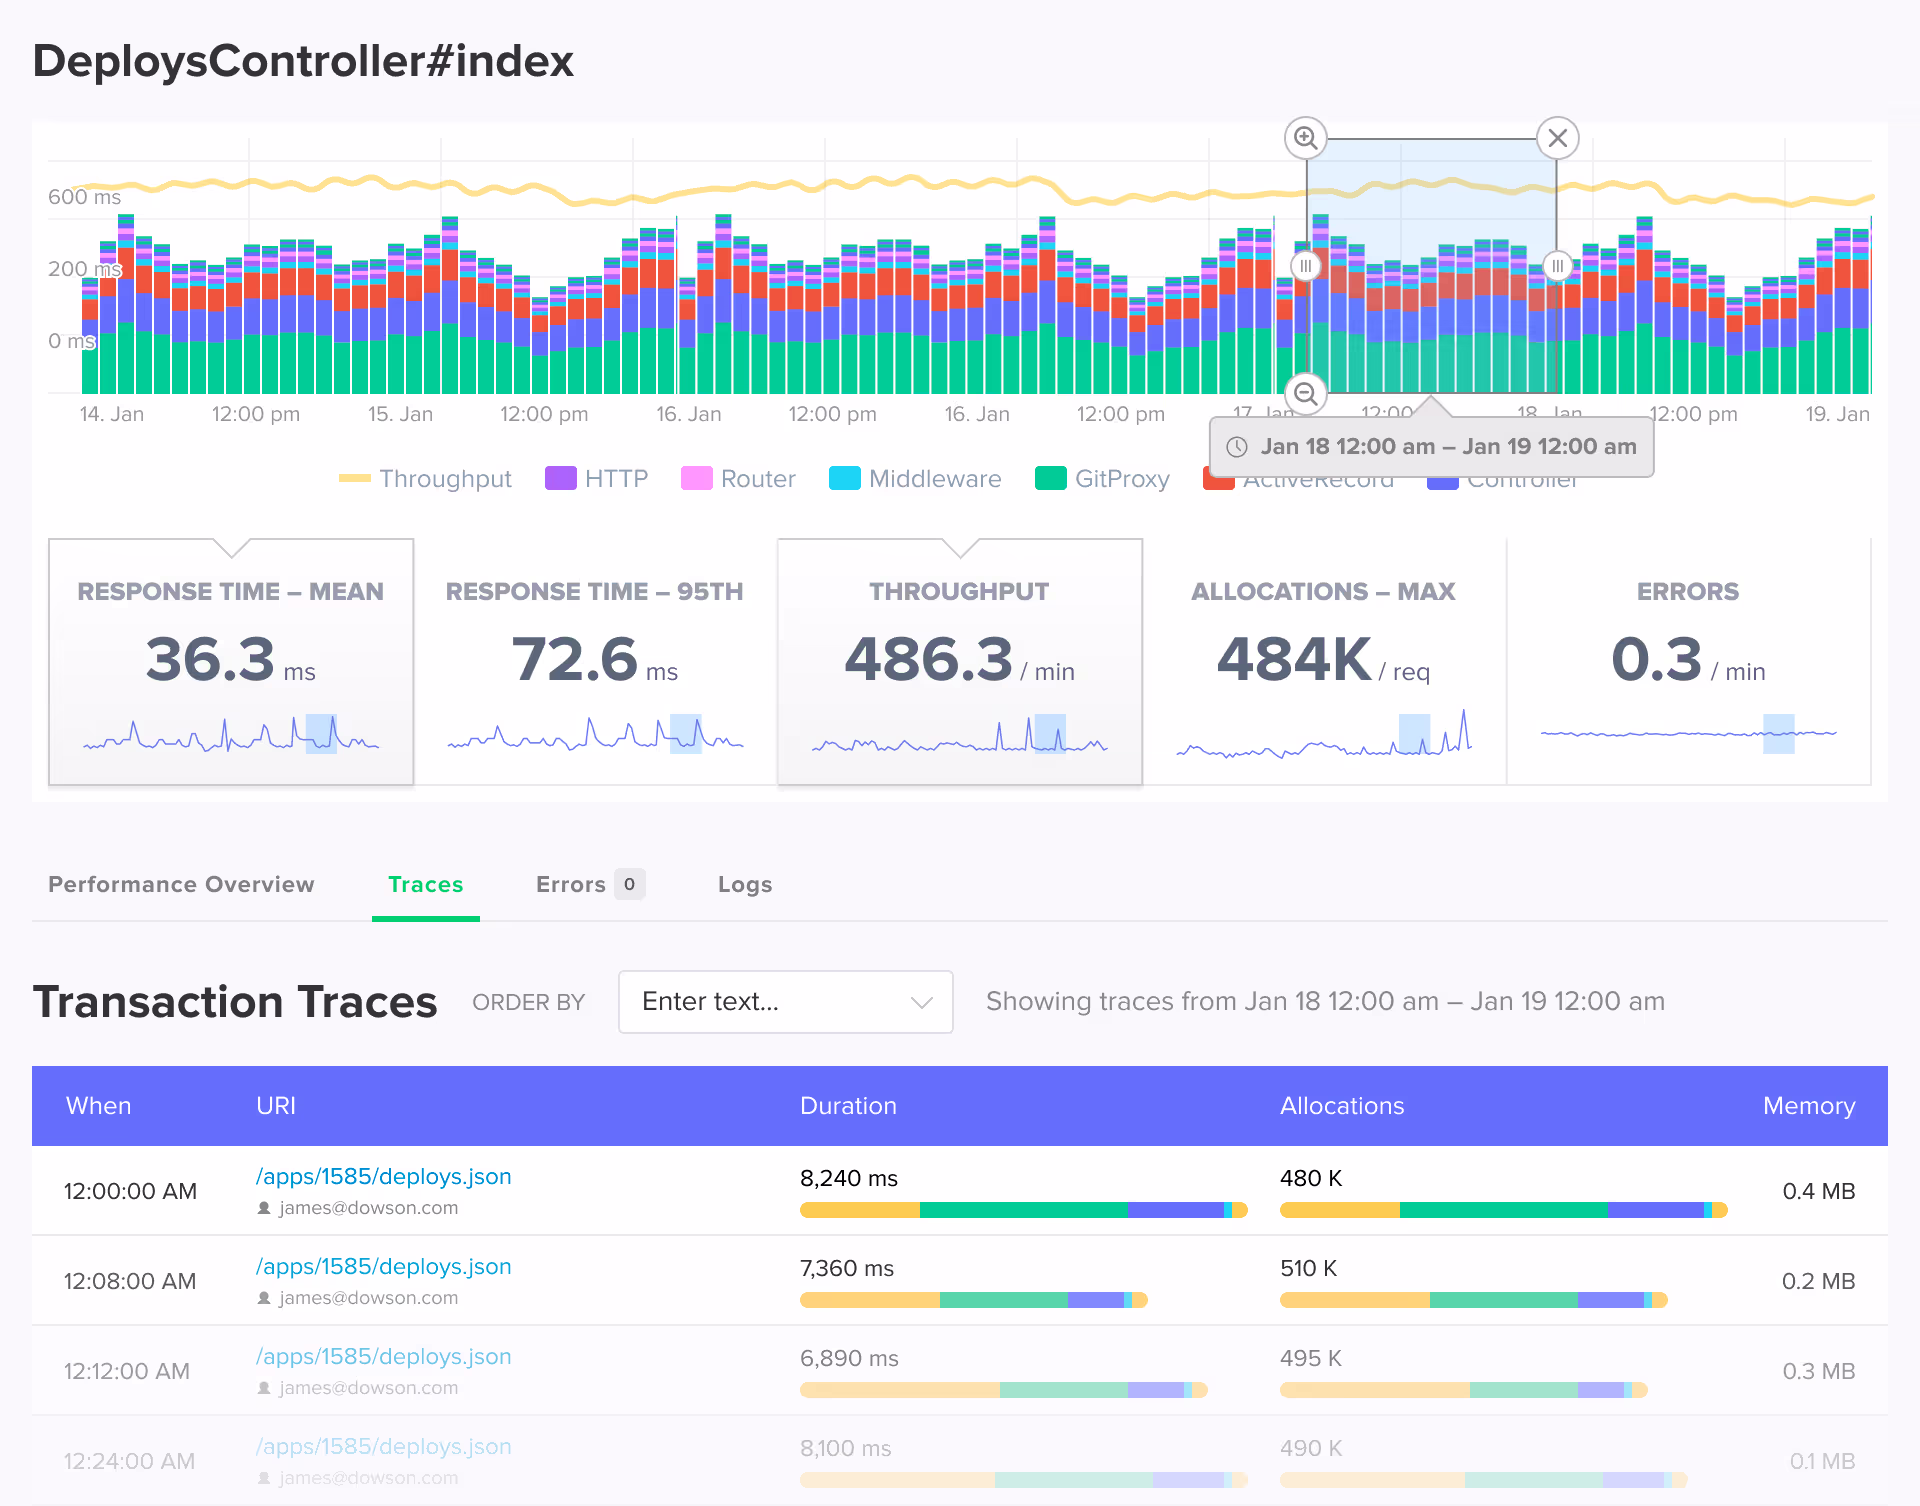
Every SQLAlchemy query appears in the transaction trace with individual timing, the query text, and the code location. Slow queries are surfaced prominently so you can trace them to the originating call site.
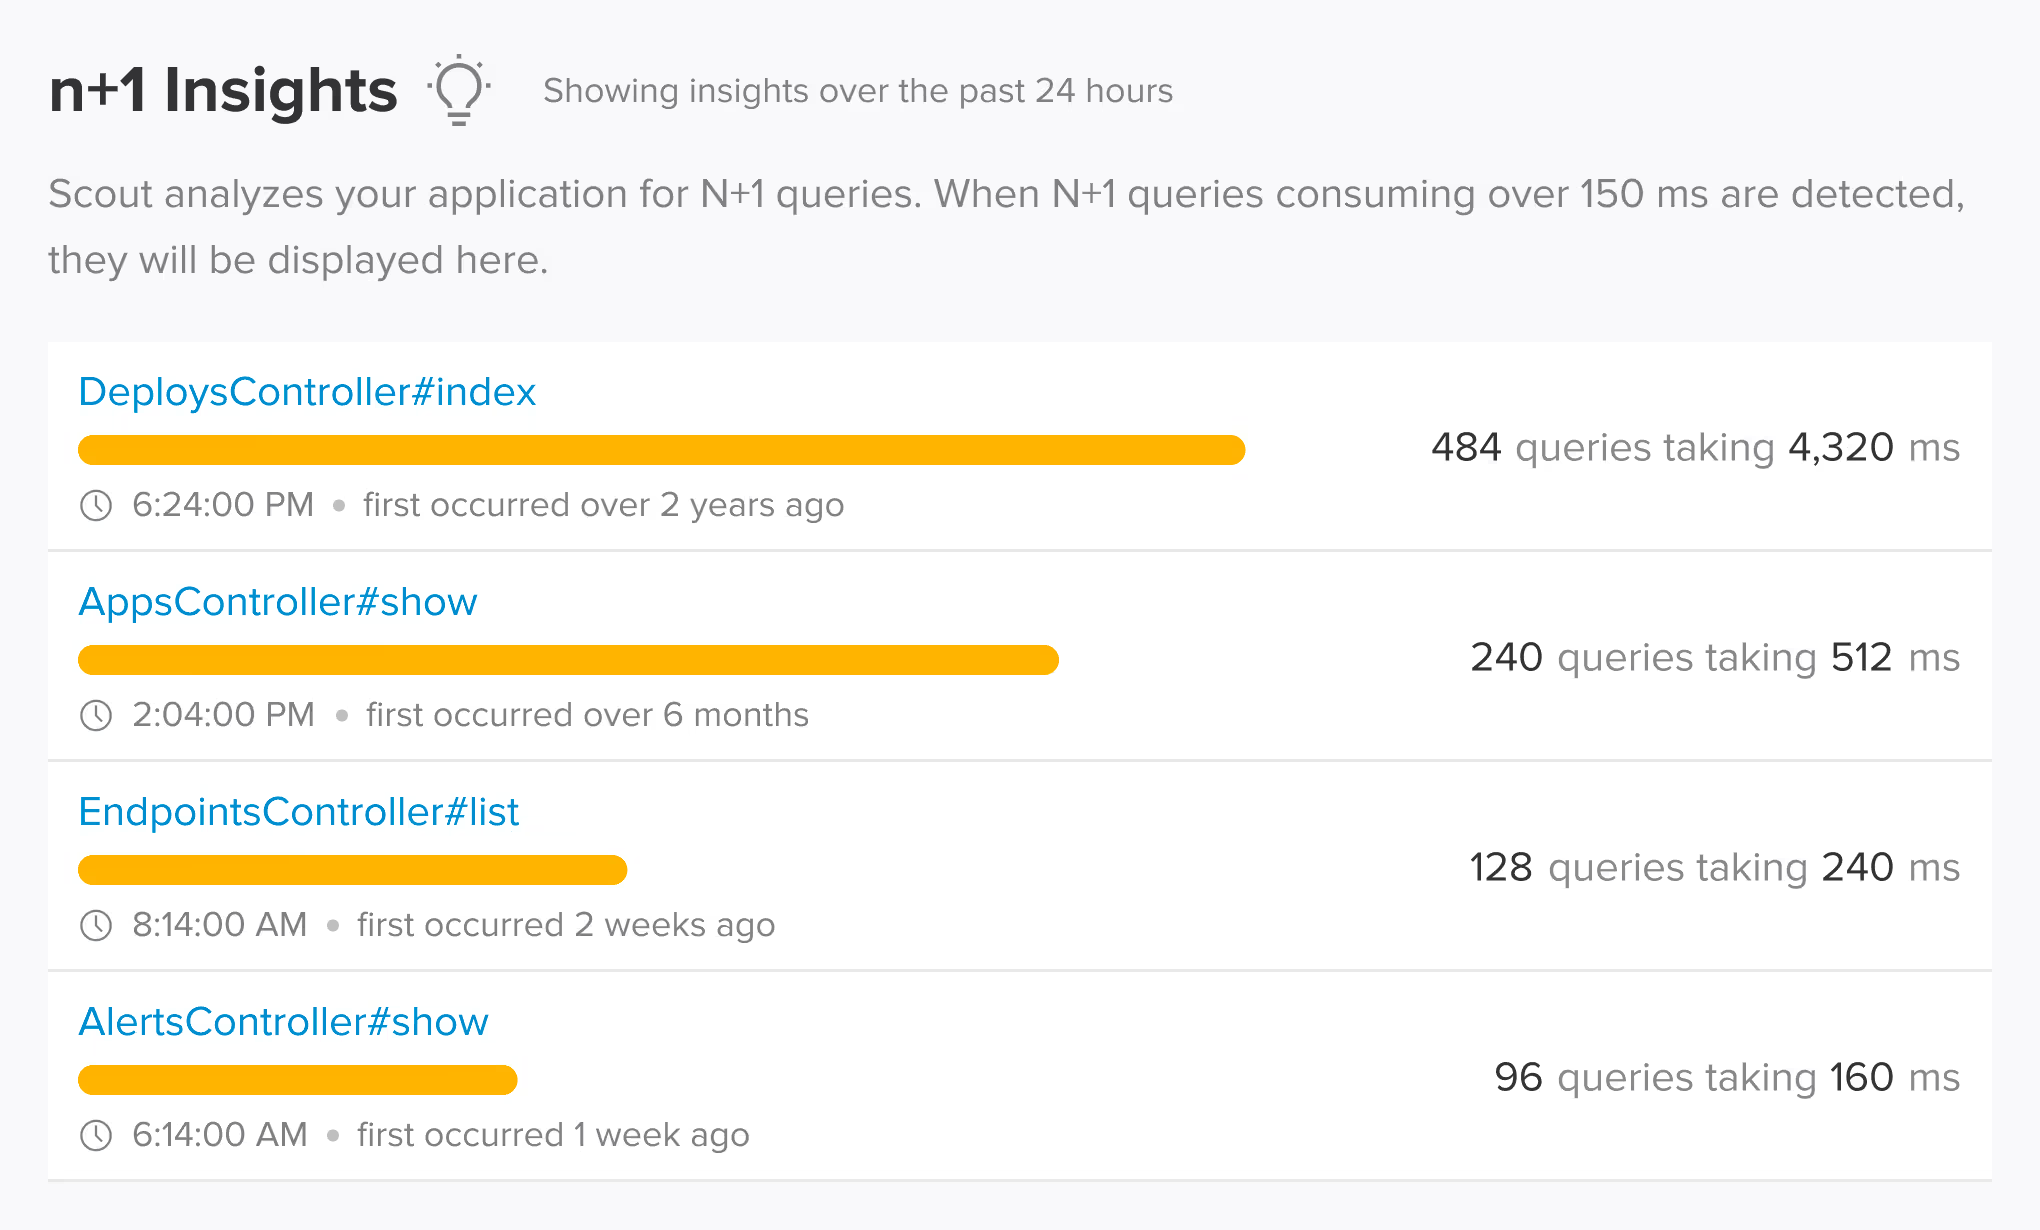
Automatic N+1 Detection in SQLAlchemy
Scout automatically detects N+1 query patterns in SQLAlchemy without configuration. The agent monitors database queries within Flask route handlers, FastAPI endpoints, Django views, and Celery tasks, identifies repeated query patterns triggered by lazy loading, and shows the exact code location and performance impact. Supports SQLite, PostgreSQL, MySQL, MariaDB, Oracle, MS SQL, and CockroachDB.
SQLAlchemy Instrumentation Across All Supported Databases
Scout instruments SQLAlchemy at the engine level, capturing every query regardless of which ORM session or connection pool issued it. Works with SQLAlchemy Core, ORM, and async sessions. All major databases are supported including SQLite, PostgreSQL, MySQL, MariaDB, Oracle, MS SQL, and CockroachDB.
Works with the SQLAlchemy frameworks you already use
Scout auto-instruments the frameworks and libraries in your stack. No manual configuration required.
Database
- SQLAlchemy
- PostgreSQL
- MySQL
- SQLite
- MariaDB
- CockroachDB
Web Frameworks
- Flask
- FastAPI
- Django
- Starlette
Task Queues
- Celery
- Dramatiq
- Huey
- RQ
Memory Bloat Detection for SQLAlchemy
SQLAlchemy queries that return large result sets can contribute to memory growth in your Python application. Scout detects memory bloat at the transaction level, showing which requests and tasks are responsible for memory increases.
Query Your SQLAlchemy App Data from AI Assistants and the Terminal
Scout offers hosted and local MCP servers with 17 tools, a Go CLI available via Homebrew with TOON format for LLM output, and a public API. Query your SQLAlchemy N+1 insights, slow query data, and query performance from Claude Code, Cursor, or the terminal.
MCP Server
Hosted or local MCP server with 17 tools covering apps, endpoints, traces, errors, insights, background jobs, and usage data. Works with Claude Code, Cursor, VS Code Copilot, and any MCP-enabled assistant.
Scout CLI
Go binary available via Homebrew. Query app metrics, endpoint performance, traces, error groups, and insights from the terminal. Outputs human-friendly tables or TOON format for LLM consumption.
Public API
Full programmatic access to your monitoring data for building custom integrations, dashboards, or automation workflows.
Add Scout to Your SQLAlchemy App
Get Scout running on your Python app in under 3 minutes.
Install the package:
pip install scout-apmConfigure in your application settings and add your Scout key.
Deploy and see data in 5 minutes.
SQLAlchemy Monitoring FAQ
How do I detect N+1 queries in SQLAlchemy?
Scout automatically detects N+1 query patterns in SQLAlchemy without any configuration. The agent instruments SQLAlchemy at the engine level, identifies repeated query patterns triggered by lazy loading or loops, and shows the exact code location, the number of excess queries, and the total performance impact.
Does Scout work with SQLAlchemy async sessions?
Yes. Scout instruments SQLAlchemy at the engine level, so it captures queries from both sync and async SQLAlchemy sessions. This includes asyncpg-based connections for PostgreSQL and async MySQL drivers.
What databases does Scout support with SQLAlchemy?
Scout instruments SQLAlchemy queries across all major databases: SQLite, PostgreSQL, MySQL, MariaDB, Oracle, MS SQL Server, and CockroachDB. The agent instruments at the SQLAlchemy engine level, so it works regardless of which underlying database driver you use.
Does Scout show individual SQLAlchemy query timing?
Yes. Every SQLAlchemy query appears in the transaction trace with individual timing, the query text, and the code location. Slow queries are surfaced prominently so you can trace them back to the originating call site in your view or task code.
Does Scout instrument SQLAlchemy Core as well as the ORM?
Yes. Scout instruments SQLAlchemy at the engine level, so it captures queries from both SQLAlchemy Core (using engine.execute or connection.execute) and the ORM (using Session.query or the 2.0-style select). Both approaches appear in the transaction trace with full timing.
Does Scout work with Heroku for SQLAlchemy apps?
Yes. The Heroku addon automatically configures SCOUT_MONITOR and SCOUT_KEY. You only need to set SCOUT_NAME to identify your application. Scout supports Heroku's dyno-based architecture for SQLAlchemy applications.
Can I get Scout through AWS Marketplace?
Yes. Scout is available on AWS Marketplace for teams that prefer to consolidate monitoring spend with their AWS account. The same SQLAlchemy agent and features work regardless of how you purchase. See our AWS Marketplace listing at /aws-marketplace-application-monitoring for details.
Does Scout work with DigitalOcean for SQLAlchemy apps?
Yes. Scout is available as a DigitalOcean addon. It integrates with your existing DigitalOcean billing and works with SQLAlchemy applications running on DigitalOcean App Platform or Droplets.