Most APMs tell you something is wrong. Scout tells you why.
Scout traces every slow request to the exact query, method call, or external service causing it. Not just a dashboard showing something is off. The specific line of code, the backtrace, and what to do about it. So your engineers can fix the problem and get back to building.
Scout also connects directly to your AI assistant. Send a slow trace, an error, or an N+1 query straight to Claude or Cursor and let your AI help you fix it, with real production context already attached.
Deep visibility. Zero complexity.
Scout gives engineering teams the application-level insight they need without the operational overhead of a large enterprise platform.
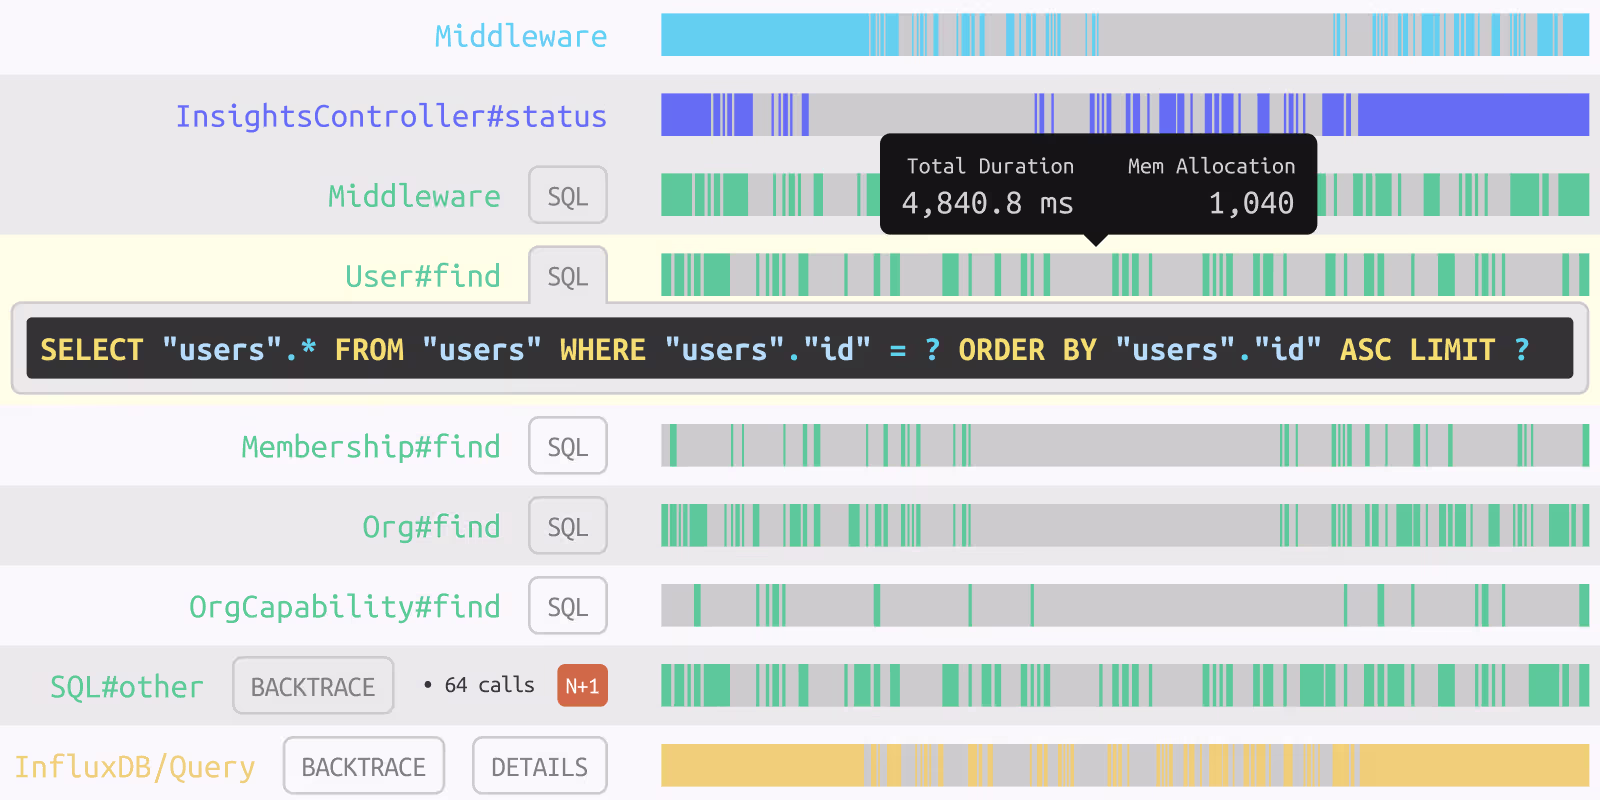
From symptom to cause in seconds
Scout connects slow requests directly to the exact query, method call, or external service causing the slowdown. No log hunting, no guessing. Just the answer and where in the code to fix it.
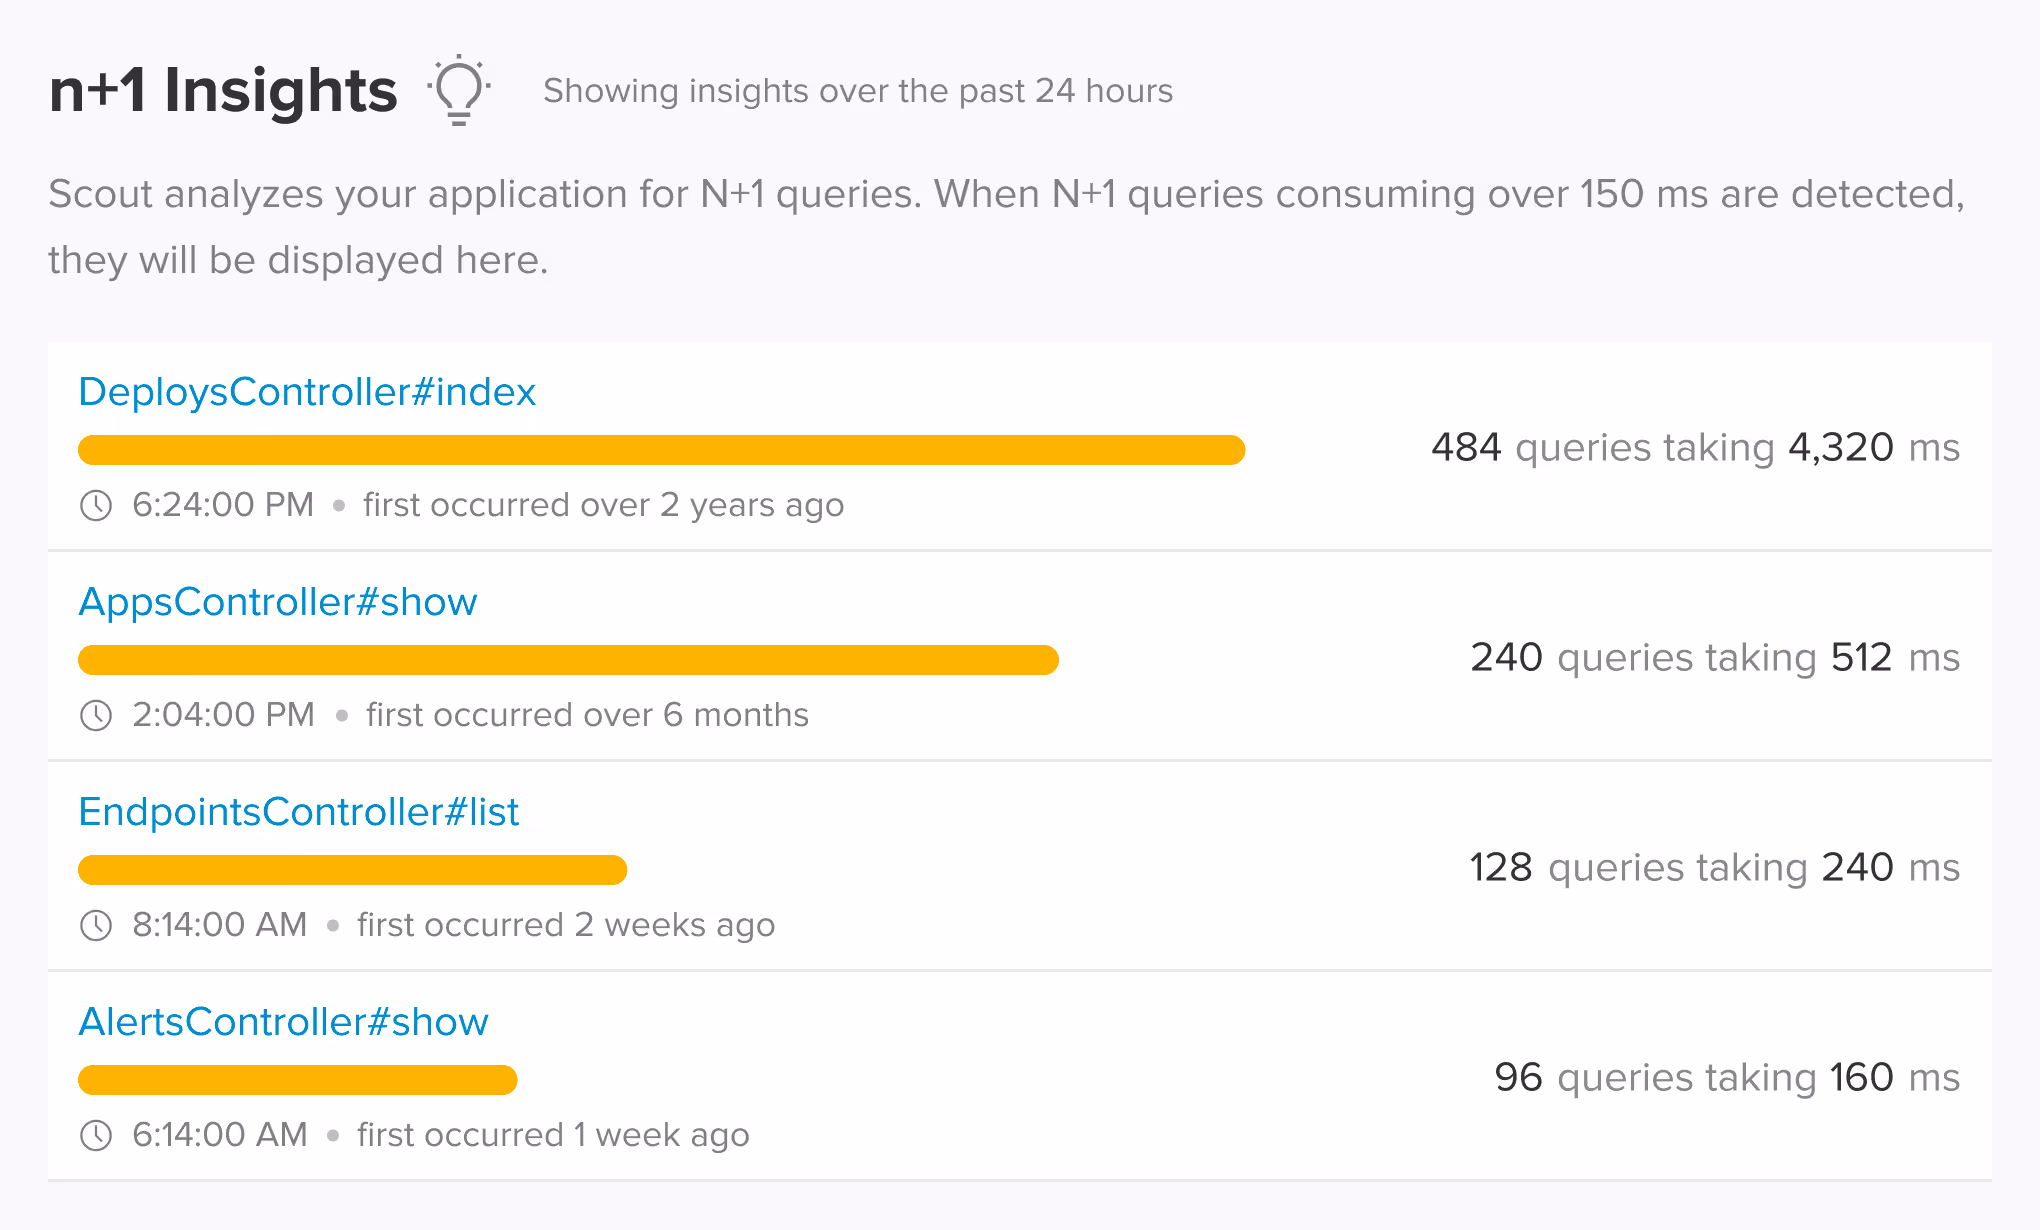
N+1 and memory bloat, caught automatically
Scout surfaces N+1 queries and memory bloat ranked by actual impact, without any instrumentation effort from your team. Our customers regularly see 2-3x performance improvements from fixes Scout surfaces.
Performance data inside your AI workflow
The Scout MCP server and Scout CLI bring real production data directly into Claude, Cursor, and other AI coding tools. Ask about slow endpoints, get trace context, and file a GitHub issue without leaving your editor.
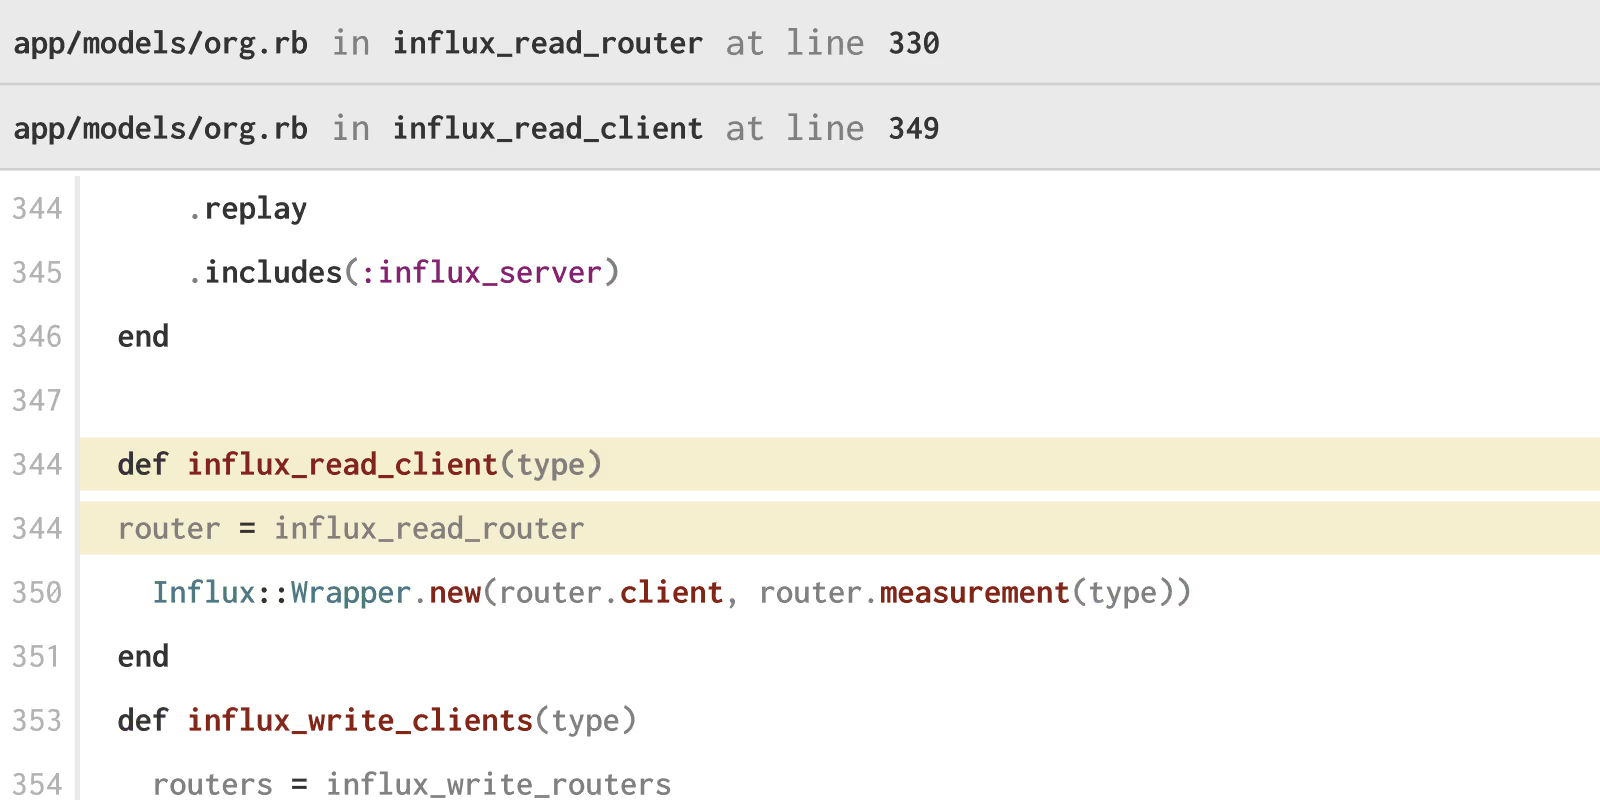
Order.items loading without eager loading. Add .includes(:items) to fix it.Code-level context, not just metrics
View backtraces in language-specific syntax alongside SQL queries, timing breakdowns, and GitHub links showing who wrote the code and when it was deployed.
Everything your application does, covered
Request Tracing
End-to-end visibility into every request, from controller to database query, with timing breakdowns for each layer.
Query Analysis
SQL-level insight with automatic detection of slow queries and N+1 patterns, ranked by impact.
Error Monitoring
Errors tracked alongside traces and logs so you always have full context when something breaks.
Log Management
Unified logs with performance context and powerful filtering. No separate log platform required.
App Metrics
Real-time response times, throughput, and resource usage across all endpoints and background jobs.
Alerting
Threshold-based alerts via Slack, PagerDuty, email, and more. Plus SmartMonitoring for anomaly detection with no configuration.
Trusted by engineering teams for years
We made our requests 70% faster by identifying common bottlenecks in all requests thanks to Scout's detailed breakdowns. Every other day, we say, "Let's go to Scout!" Their dashboard is refined. They are as obsessed about the quality of their product as we are.
ScoutAPM proved to be indispensable in identifying and troubleshooting several crucial performance issues that would have remained unnoticed without its capabilities. It has been pivotal in enhancing the stability and efficiency of the Genius Scan backend, resulting in an enhanced user experience for millions of users.
Support from people who know the product
When production is on fire, you need a fast answer. Not a chatbot or an escalation queue. Scout's support is handled directly by people who understand the product and work with customers every day. No outsourced support, no endless tiers.
Up and running in minutes
Installation is a gem, a pip package, or a composer require away. Scout's lightweight agent adds minimal overhead (typically under 1%) and starts delivering actionable data immediately. No complex configuration, no dedicated observability engineer required.
Our dream for every developer
We want to get you up the stack.
Every hour your engineers spend chasing down a slow query or reproducing a performance regression is an hour not spent building something meaningful. We built Scout to take that work off their plate. Not just to save time, but to change what kind of work your team does. Less reactive. More creative. That is what we are going for, and we want it for every team that trusts us with their application.