NestJS v12 Ships Native Observability: What It Means for Your APM
NestJS 12 launches @nestjs/observe, a native observability SDK. We break down what it does, where it falls short, and how it compares to cross-stack APM.
NestJS 12 launches @nestjs/observe, a native observability SDK. We break down what it does, where it falls short, and how it compares to cross-stack APM.

Starlette has an open PR to add native OTel spans. Here's what that means if you run Starlette or FastAPI with an APM tool.
AI applications need two layers of monitoring: LLM observability for output quality and token costs, and traditional APM for the application code underneath. A practical guide to what tools cover which layer.

An honest comparison of the 10 best application monitoring and observability tools in 2026. Covers Scout Monitoring, Datadog, New Relic, Grafana Cloud, Sentry, Elastic Observability, AppSignal, Honeybadger, Honeycomb, and Better Stack with pricing, setup time, and use case guidance.
Three monitoring tools means three context switches per debugging session. One tool with linked errors, traces, and logs gets you to root cause faster.
The Scout MCP server connects your AI assistant directly to your Scout Monitoring data. Here's how teams are using it, what prompts work well, and what shipped in June.

Application performance monitoring gives engineering teams visibility into how their software behaves in production. Here is what APM is, what it measures, and how modern teams use it to go from alert to fix.
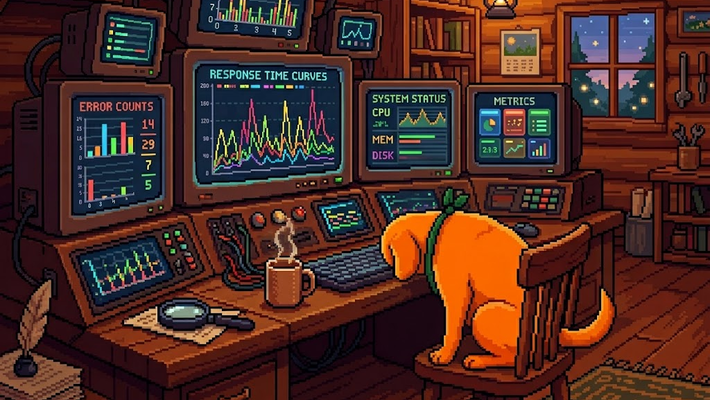
Understanding what your application performance metrics mean both independently and together is key in effectively using your APM system.

A workflow that connects Scout's MCP server to an AI assistant to automatically triage production errors overnight and open draft PRs with proposed fixes — so your team starts the day reviewing solutions, not stack traces.

Elixir agent 2.0 adds error monitoring and log management, the Scout CLI is now available via Homebrew, and new public API endpoints and MCP server updates ship this month.

AI-native monitoring is designed for teams shipping AI-generated code. It brings errors, metrics, and performance data into your LLM, where you already work. Learn how this new approach helps developers tame black-box AI code, cut tool sprawl, and stay in flow — making apps built with AI-generated code easier to debug, scale, and trust.
OpenTelemetry is enabling a revolution in how Observability data is collected and transmitted. See our What Is OpenTelemetry post on why this is an important inflection point in the Observability space. In this post, we’ll walk through how to configure the OpenTelemetry Gems within a Rails app.
Observability: the degree to which you can ask new questions of your system without having to ship new code or gather new data. Above is my slightly modified definition of observability, mostly stolen from Charity Majors in Observability: A Manifesto . Observability is increasingly important . Modern apps and services ...