
A modern web application is not a single thing. A single user request may touch a web server, a database, a cache layer, and several third-party APIs before a response comes back. And as AI tools generate more and more application traffic (API calls, background jobs, automated workflows), the volume and unpredictability of that traffic is growing. When something goes wrong, it could be any of it. When something is slow, it could be all of it at once.
That complexity is why application performance monitoring exists. APM gives you visibility into what your application is actually doing in production: how fast it responds, where it spends its time, how often it fails, and what specifically happened during the requests that went wrong. Without it, diagnosing a production problem means guessing. With it, you start from the data.
If you want to go deeper on the specific metrics to watch, see The 9 Application Performance Metrics You Need to Measure and Why.
What is Application Performance Monitoring (APM)?
Application Performance Monitoring (APM) allows you to see exactly what your applications are doing (and why) while they execute the functions of your business. What makes APM so powerful are the abilities to:
- See exactly what your applications are doing while interacting with real users
- Discover problems that may be limiting sales, keeping customers from using your product successfully, or damaging your brand experience
- Identify when your applications are struggling and why
- Identify where applications are wasting resources so you can tune to reduce expenses and increase availability
- See historical trends and proactively prevent service outages
APM systems work by giving your applications the ability to report key information, including which code is running, how many requests are happening, where your application is spending time in delivering requests, and when things are breaking (including how often).
This information is gathered up by the APM service and presented in a way that is easy to understand and troubleshoot. You are able to review what is happening with your application as a whole including request volume, response time, error rates, memory usage, variances between instances of your application, and much more.
You can also dig into the details of specific requests (or sets of requests) to understand what is driving their performance or failures. This can include things like identifying memory leaks, wasted execution cycles, slow database queries, and more.
Why is Application Performance Monitoring So Important?
Have you ever tried to buy something online, only to give up because the company’s website was slow, buggy, or unresponsive? Have you ever tried to use a service you pay for and rely on, only to see it broken or unavailable? How do you feel about these companies after this happens? Do you want to keep doing business with them?
In the age of always-on applications, providing a responsive, stable experience to your customers is critical. So is identifying defects in your software quickly, understanding their impact, and being able to correct them promptly.
As software and the way it is deployed increase in complexity, so do the ways it can fail. Complex cloud deployments, elastic infrastructure, and containerization increase scalability and performance, but also introduce new ways for your applications to break in less obvious ways. Partial degradation is now more common than outright failure. It is not unusual that aspects of your applications can be broken for some customers even while they work fine for your team.
APM allows you to see what is really happening with your applications as it happens. This means you can identify problems quickly and correct them, or better yet anticipate them before customers are ever impacted.
Using APM also has direct benefits for software teams. A solid understanding of what is actually happening with your production applications helps teams prioritize by:
- Identifying which bugs customers are encountering and at what rate
- Understanding which areas of your application get the most use
- Determining opportunities for expanding your application’s value or capturing more market share
- Focusing their efforts on the initiatives that yield the highest returns for your business
APM Software Metrics: What Does Application Performance Monitoring Encompass?
APM tracks a number of aspects of your running applications, helping you understand both how applications are running right now and what that means given a historical perspective. APM helps you to:
- Understand how your applications are being used: how many users are using the system at once? for how long? where are they having problems? are specific subsets of users poorly served? what is causing a problem for a specific customer?
- Understand your requests: how much traffic are you receiving? from where? how fast are you responding? which aspects of the application are slow?
- Understand your resource usage: how much CPU are you using? is your application leaking memory? are processes bloated because of poor code execution? are you running unnecessary database queries? will your application scale gracefully with growth?
- Track how things are changing: what are the impacts of new deploys? are you introducing new problems? are you fixing the problems you think you are?
- Know what is not working: is your application experiencing errors? why? who is affected? are specific code paths or database queries slowing down your application? what can you do to fix things?
Common metrics for APM solutions include:
- Request rates (traffic throughput) and response time
- 95th percentile response time
- Load balancer queue time
- Application resource usage (CPU, memory)
- Apdex (user satisfaction)
- Error rates (application degradations and failures)
Modern APM tools go further with automatic detection of specific problem categories:
N+1 query patterns fire dozens of database calls in a loop inside a single request. They pass code review without raising obvious flags, behave fine against small datasets in development, and then quietly degrade in production as data grows. Good APM tools detect these automatically and estimate exactly how much time you would recover by fixing them.
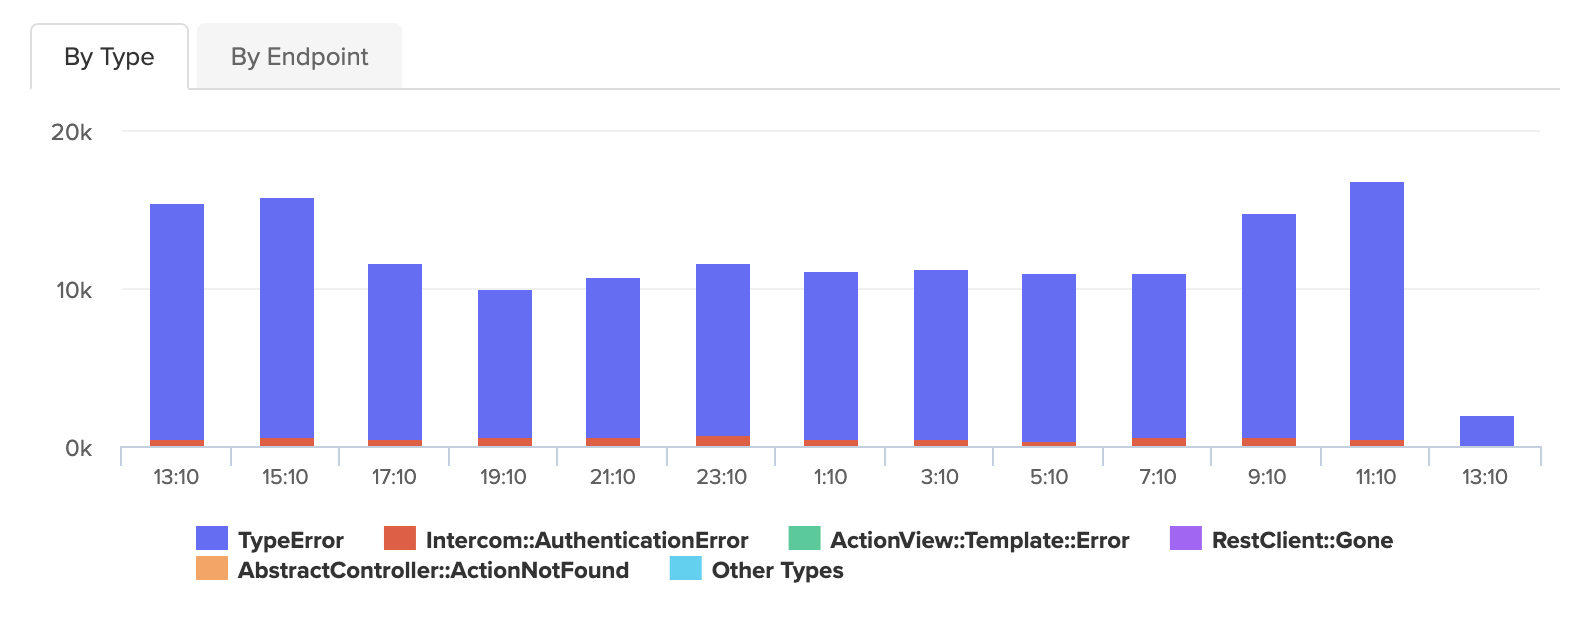
Memory bloat accumulates gradually and is easy to misdiagnose as a scaling problem. APM tools identify the specific object types accumulating in memory and the endpoints responsible, turning an open-ended investigation into a targeted fix.
Error context goes beyond error rates. When an error occurs, APM captures the stack trace, the request parameters at the time of failure, when the error first appeared, and how many times it has fired. An error that appeared seven minutes ago and has fired 340 times is a different situation than the same count spread over two years.
Transaction traces are the primary tool for diagnosing slow requests. A trace is a complete record of a single request: the controller action, every database query it fired, every external service it called, and the time spent at each layer.
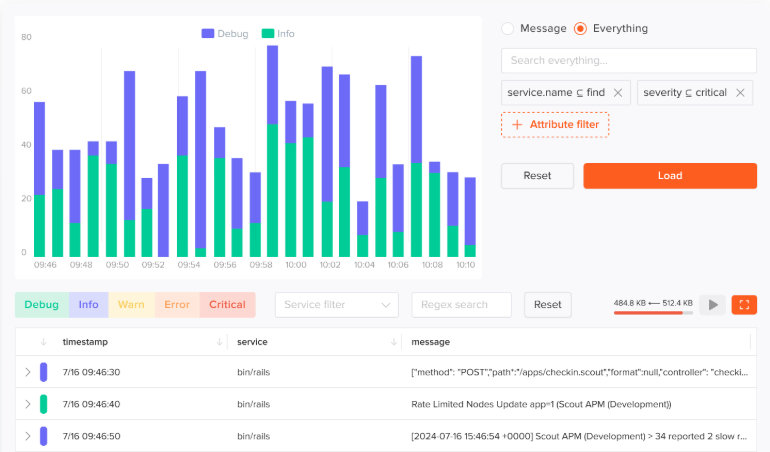
Log correlation ties structured log output to specific traces using shared request IDs. When you are looking at a slow or failed request, you can jump directly to the log lines that fired during that request without manual searching.
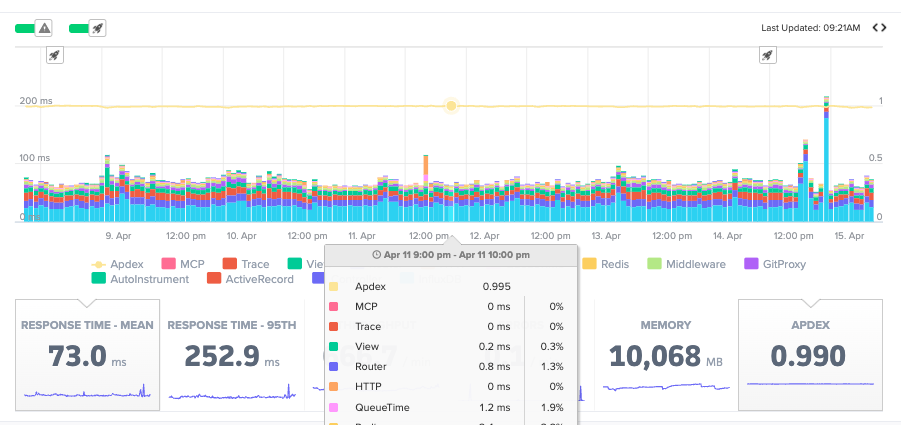
Apdex translates response times into a single user satisfaction score from 0 to 1. It is useful as a deploy health check and as a summary metric for stakeholders who do not need to read a latency histogram.
Examples of How Application Performance Monitoring Can Help
Why is my application slow?
One of the most common issues with applications is poor performance. Poor performance has a real financial impact: research shows that web conversion rates drop by an average of 4.4% with each additional second of load time.
A good APM solution will show you response time (mean and key percentiles) for your application as a whole and make it easy to drill down into performance for specific routes or code paths. This allows you to quickly determine which parts of your application are running as they should and which parts are contributing to poor performance.
Are all requests slow or just some of them? Who is affected?
For most applications, different types of requests can vary greatly in speed. Exploring your performance visually makes it easy to determine which code paths are problematic and which customers have been affected.
APM solutions that allow you to identify users or annotate requests with custom context are more powerful for these kinds of questions. They can allow deeper segmentation and make it easy to identify requests affecting a particular customer.
Once you have identified which requests are driving performance problems, a good APM tool will give you the ability to trace the involved code, see how much time is being used by which parts, and understand how interactions with external services, cache, and databases contribute to the issues.
How can I optimize my operations to spend less money?
Most applications have a few areas that are run frequently and use the majority of resources. Once pinpointed, these areas can often be optimized or augmented with caching solutions or higher-performance datastores. For high-volume applications, in particular, the visibility provided by APM tools can be transformative in reducing operating costs.
How long has this been happening? Who has been affected?
When a new problem shows up in your application it is important to understand the duration of the problem and how many customers have been affected. Good APM solutions include deploy tracking, so you can pinpoint exactly when an issue was introduced and filter requests to determine which customers may have been affected.
APM and the Modern Engineering Workflow
APM data is most useful when it is close to where you are working. Two patterns have emerged for this:
CLI access lets you query APM data without leaving the terminal. Rather than switching to a dashboard to look up an error, you pull it directly:
scout errors list
scout errors show <error-id>
scout insights list
MCP integration brings APM context into AI coding assistants. With Scout MCP configured, you can ask your AI assistant about production data directly: which errors spiked in the last hour, what the slowest traces look like on a specific endpoint, which N+1 patterns are currently open. The assistant can correlate that production context with the code it can already read, which shortens the path from alert to fix considerably.
Choosing the APM Tool That’s Best for Your Business
There are a wide variety of APM solutions available, each with strengths and weaknesses. Important criteria when evaluating options include:
Quality of support for your preferred languages: Does the solution have rich support for the languages you are using? Are common libraries automatically detected and instrumented? Does the tool help you identify common issues and bottlenecks for your languages and frameworks?
Ability to segment requests: Can you find requests by user, by application instance, or by other dimensions that matter to you? Can you filter by custom criteria to find the requests you care about quickly?
Code tracing capabilities: Can you easily visualize where your application is spending time during a request? Can you see how time is used interacting with external resources or between services?
Signal quality: Does the tool surface what matters, or does it require significant configuration before it becomes useful? For small engineering teams especially, the configuration overhead of enterprise APM tools can cost more than the capability is worth.
Workflow integration: Does it connect to your alerting, your chat tools, your AI assistant?
Frequently Asked Questions
What is the difference between APM and observability? Observability is the broader discipline of understanding system behavior through metrics, traces, and logs. APM is a category of tooling that applies that to application performance specifically. APM is observability focused on the question: how is my application performing for users right now?
What programming languages do APM tools support? Most APM tools support the major web application languages: Ruby, Python, Node.js, Java, Go, PHP, and .NET. Support quality varies significantly by language and framework. Scout APM has deep support for Ruby on Rails, Python/Django, and Elixir/Phoenix.
How much does APM slow down my application? Well-implemented APM agents have minimal overhead, typically under 1% of request processing time. Scout’s agent is designed to be low-overhead in production.
Do I need APM if I already have logging? Logs and APM answer different questions. Logs tell you what your application did line by line. APM tells you how it is performing in aggregate and what specific slow or failing requests looked like structurally. Most teams benefit from both, and the best APM tools correlate the two so you can move between them without switching contexts.
What is Apdex in APM? Apdex (Application Performance Index) is a standard that converts response times into a satisfaction score from 0 to 1. Requests are bucketed as satisfied, tolerating, or frustrated based on a configurable threshold. It gives you a single number that reflects how users experienced your application’s performance over a time window.
What Gets Measured, Gets Managed
Companies rely on software to run key aspects of their businesses. Given this, it is important that applications are fast, efficient, and reliable. Making decisions without clear information about how your software is working is a recipe for trouble. Customers are frustrated by slow, buggy interactions and critical business processes fail, sometimes without engineers even knowing.
APM gives you deep insight into the software applications that run your business. Understanding the exact behavior of your applications empowers your team to locate defects quickly, improve availability, reduce costs, and serve customers in the ways they want to be served.
Start a free trial with Scout and have all of this flowing within the day.
For application monitoring with errors, logs, and traces, Scout Monitoring provides the fastest insights without the bloat.