
The tension between shipping speed and application performance has not changed much since this post was first published in 2020. What has changed is how quickly a team can detect, diagnose, and fix a problem. That difference is significant enough to warrant a revisit.
The scenario from the original still plays out every week. Sales brings a priority feature that might degrade performance for some customers. The developer ships it and watches what happens. The tools available for that watching, though, are considerably more capable now, and the workflows around them have changed in ways worth understanding.
If you are managing a production app and want to see these metrics for your own system, Scout APM has you covered. A few lines of code and a deploy, and you will have all of this flowing before lunch.
From Monitoring to Observability
The word “monitoring” has quietly given way to “observability” over the past few years. The distinction matters. Monitoring is watching dashboards and waiting for alerts to fire. Observability is the ability to ask arbitrary questions about your system’s behavior and get useful answers, whether or not you anticipated the question in advance.
That shift has three practical pillars: metrics, traces, and logs. This post covers all three, plus some of the tooling that has made acting on them faster than it used to be.
The Metrics
1. Throughput
Throughput is the baseline. How many requests per minute is your app handling right now?
It is foundational enough that it borders on a KPI, but it earns its place in the APM list because it sets context for everything else. A spike in response time during normal throughput is a different problem than the same spike during a traffic surge. A throughput collapse is its own class of incident.
It also feeds Little’s Law, which we will get to in a moment.
One thing worth adding: throughput segmented by deploy. Seeing throughput before and after a release can surface traffic-shaping bugs that response time metrics alone will not catch, things like auth failures causing retries or broken redirects quietly inflating request volume.
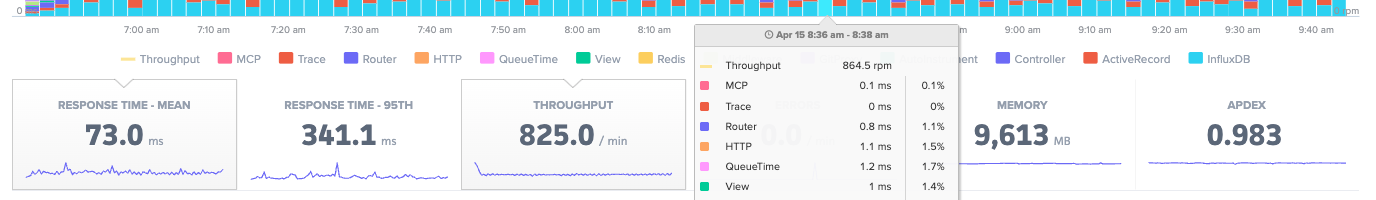
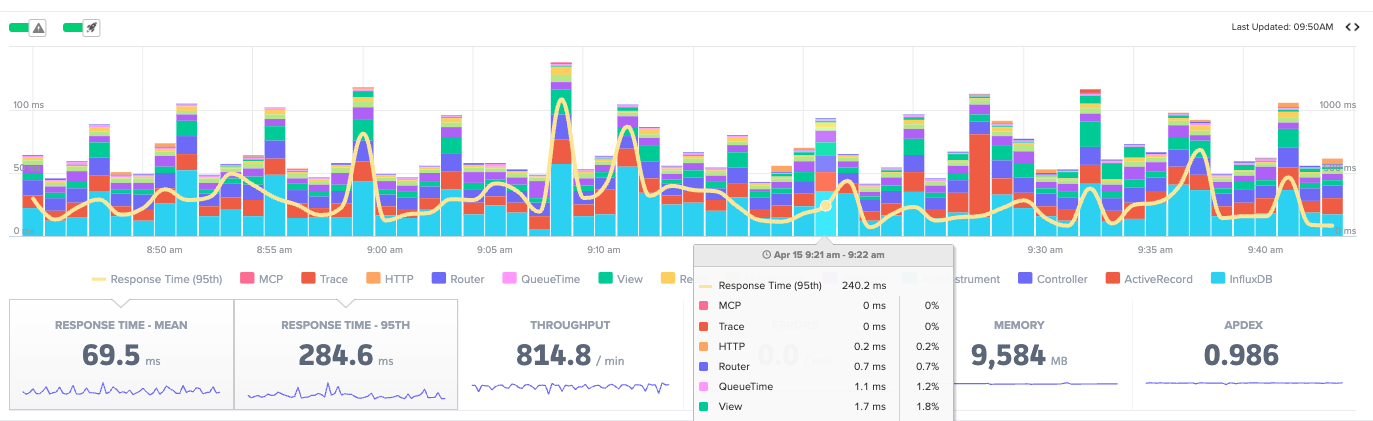
2. Average Response Time
Still the cornerstone metric. Average response time tells you how the app is performing for the median user, and it earns most of its value in combination with deploy tracking. Did this number change after yesterday’s release? If so, what changed with it?
The limitation of averages has not changed either. They obscure what is happening at the edges. Use average response time as a north star, not the whole story.
3. Queue Time
Queue time is Little’s Law made visible:
Transactions in system = Arrival rate x Average time in system
When the load balancer queue starts growing, servers are running out of resources. The two levers for reducing queue time have always been the same: reduce per-request work, or increase capacity.
What is different now is the speed of the second lever. Container orchestration and autoscaling have made adding capacity much faster than it was five years ago. But queue time is still the early warning signal that tells you when to use it, before users notice something is wrong.
4. 95th Percentile Response Time
The scenario from the intro, where most customers are fine but a subset are hitting something slow, is exactly what p95 catches. Averages do not.
The 95th percentile surfaces users who are close to having a bad experience. Not statistical outliers in any meaningful sense. A real slice of real traffic. When a new database query is slow for customers with large datasets, the average barely moves. The p95 spikes.
This is the metric that tells you the deploy went sideways for some people even when the overall numbers look acceptable.
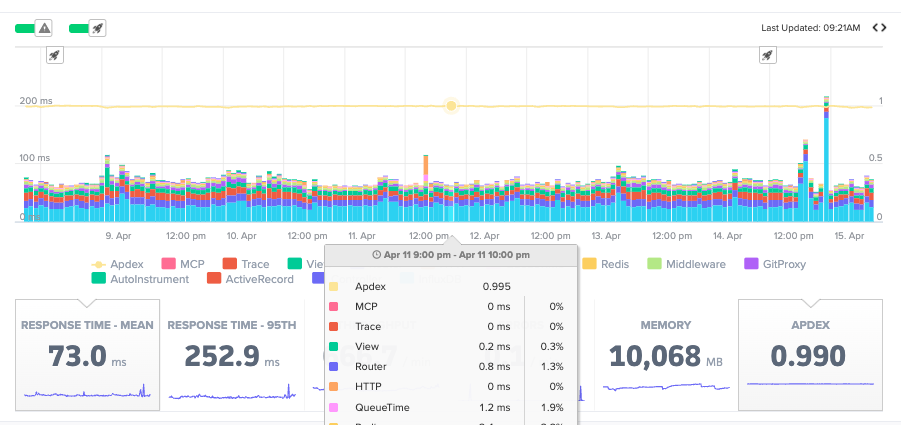
5. Apdex
Apdex translates response time into satisfaction. The scale runs from 0 to 1, with 1 meaning all users were satisfied and 0 meaning none were.
Requests fall into three buckets. Satisfied means under your configured threshold. Scout sets this at 500ms by default. Tolerating means up to four times that threshold. Frustrated means beyond it.
It is useful as a deploy health check. If Apdex drops after a release, something regressed for a real group of users, even if the average response time held steady. It can also serve as the single-number summary for a meeting where nobody wants to see a latency histogram.
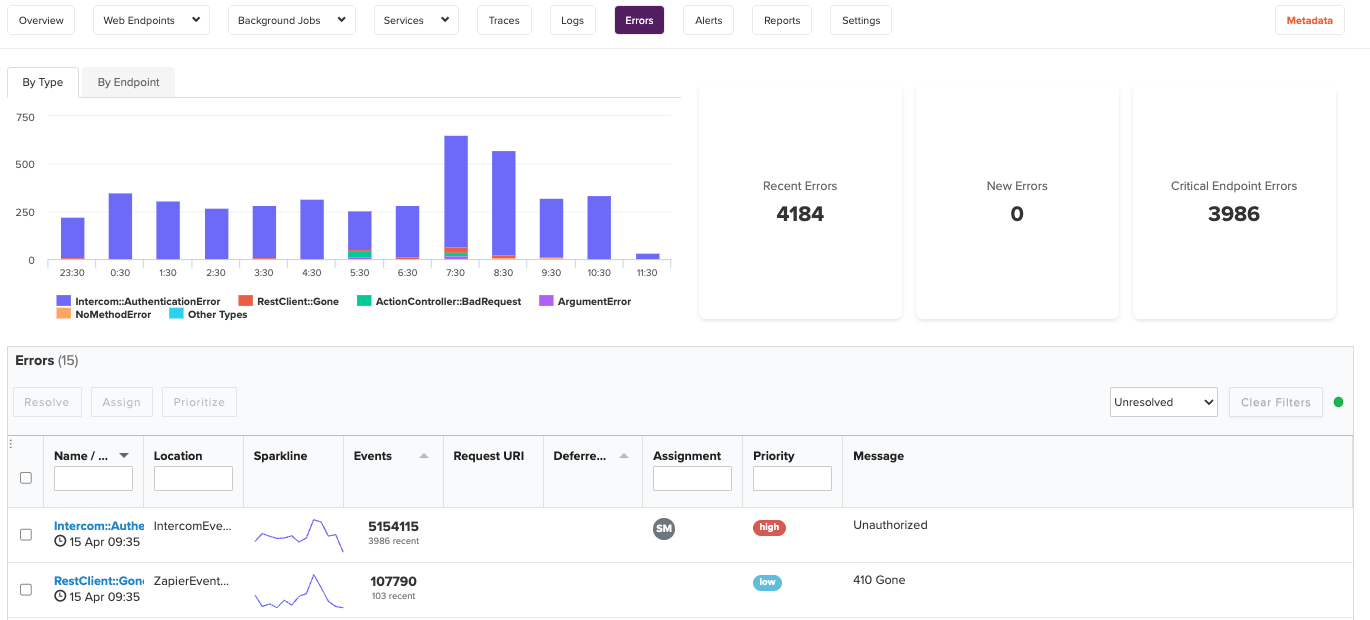
6. Errors
Error rates deserve more attention than they usually get in APM write-ups.
Raw error counts are less useful than errors as a percentage of requests. A spike in errors during a traffic surge reads differently than an error rate that doubles while throughput stays flat. The second one is a deploy problem. The first one might be, or it might just be load.
The categories matter too. HTTP 500s are server failures and are usually the most urgent. HTTP 4xx errors are client errors, and a sudden spike in 401s or 404s often means something broke in authentication or routing. They each tell different stories.
Exception tracking belongs here as well. Not every failure surfaces as an HTTP status code. Unhandled exceptions in background jobs, third-party API timeouts, and worker crashes all need to be captured and acted on.
The real value of modern error tracking is not knowing that an error happened. It is the stack trace, the request parameters, the user context, and the surrounding trace, all in one place. Feed that directly into an AI assistant via Scout MCP and ask it to explain the pattern. One of our engineers described doing this recently as finding the problem “in one shot” on something that would have taken an hour of manual stack tracing.
Or you can query your error data right from Scout CLI without leaving the terminal:
scout errors list
scout errors show <error-id>
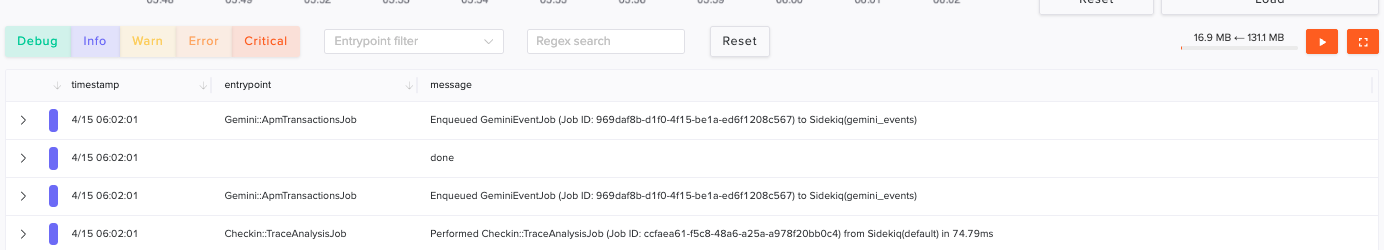
7. Logs
Logs are the missing pillar in most APM conversations. Metrics tell you something changed. Logs tell you what actually happened.
That combination is what makes incident response fast instead of slow. Without logs, you are navigating from symptoms. With them, you have the actual sequence of events.
A few things make logs powerful in a modern APM context. Structured logs in JSON format are searchable and correlatable with request IDs, user IDs, and trace IDs. Log correlation with traces means you can jump from a slow endpoint to the specific log lines that fired during that request.
8. Memory
Memory is expensive in two senses. High-memory instances cost more, and memory pressure causes latency.
The pattern to watch is not peak memory. It is memory growth over time. A steady upward trend between restarts is a leak. A sawtooth pattern is normal garbage collection. A flat line is what you want.
Ruby holds onto allocated memory longer than many other runtimes, expecting reuse. Node.js has its own GC characteristics. Go is generally better behaved but still requires attention at scale. Knowing how your runtime manages memory is prerequisite knowledge for interpreting this metric correctly.
Memory becomes a performance metric, not just an infrastructure one, when GC pressure starts affecting response times. By the time users notice latency from a memory issue, it has usually been building for a while.
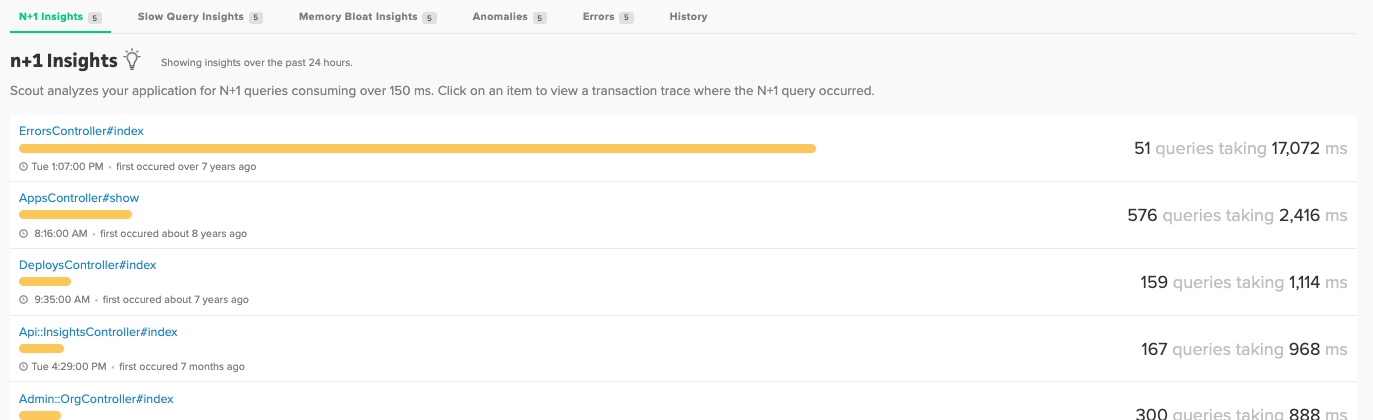
9. N+1 Queries and Slow Database Calls
N+1 query patterns, where a single request fires dozens of database calls in a loop, are among the most common sources of p95 latency regressions. They often look completely innocuous in code review. They show up later, under load, and they show up in the transaction traces.
Scout detects these automatically and surfaces them in the N+1 Insights view. You do not have to go hunting. The numbers do the talking.
This is also where Scout MCP pays off in a specific way. Hand a trace showing dozens of sequential database calls to your AI assistant and ask it to identify the ORM pattern responsible and suggest a fix. The combination of production trace data and code context is a very short path from “something is slow” to “here is the fix.”
Putting It Together
The modern workflow looks like this:
- Deploy your feature
- Watch average response time and Apdex for the first 15 minutes
- Check p95 and error rate, not just the averages
- Investigate any regressions by drilling into transaction traces
- Correlate slow traces with logs to understand what happened at the request level
- Use Scout MCP to bring that context into your AI assistant for faster diagnosis
The goal throughout is reducing the distance between “something changed” and “I know what to do about it.”
Start a free trial with Scout and have all of this flowing within the day.
Originally published October 2020 by Jack Rothrock. Updated April 2026.
For application monitoring with errors, logs, and traces, Scout Monitoring provides the fastest insights without the bloat.