Application monitoring for your DigitalOcean apps, billed through your DO account
Scout's DigitalOcean Marketplace add-on gives you errors, logs, and traces for your Rails, Django, Flask, Laravel, or Phoenix application. Add it from the DigitalOcean Marketplace and keep your monitoring spend consolidated with your infrastructure.
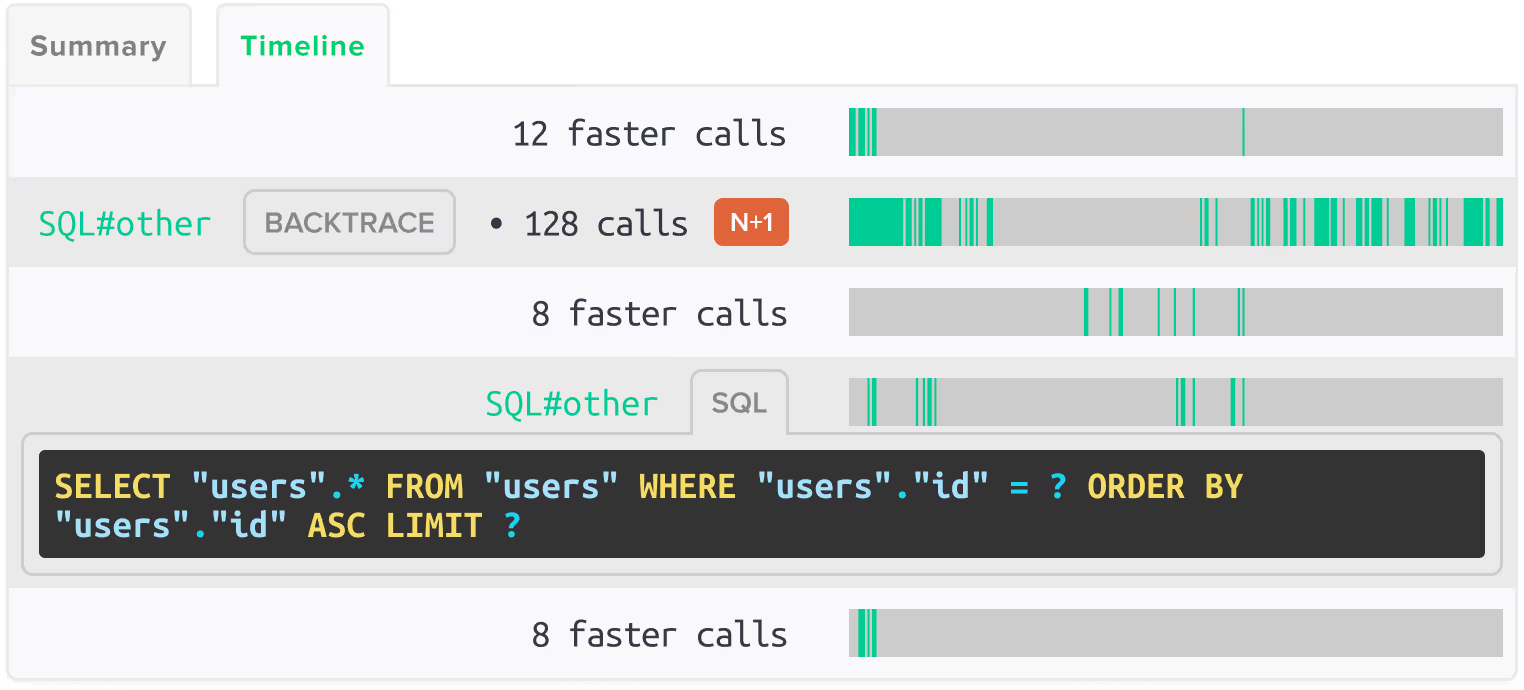
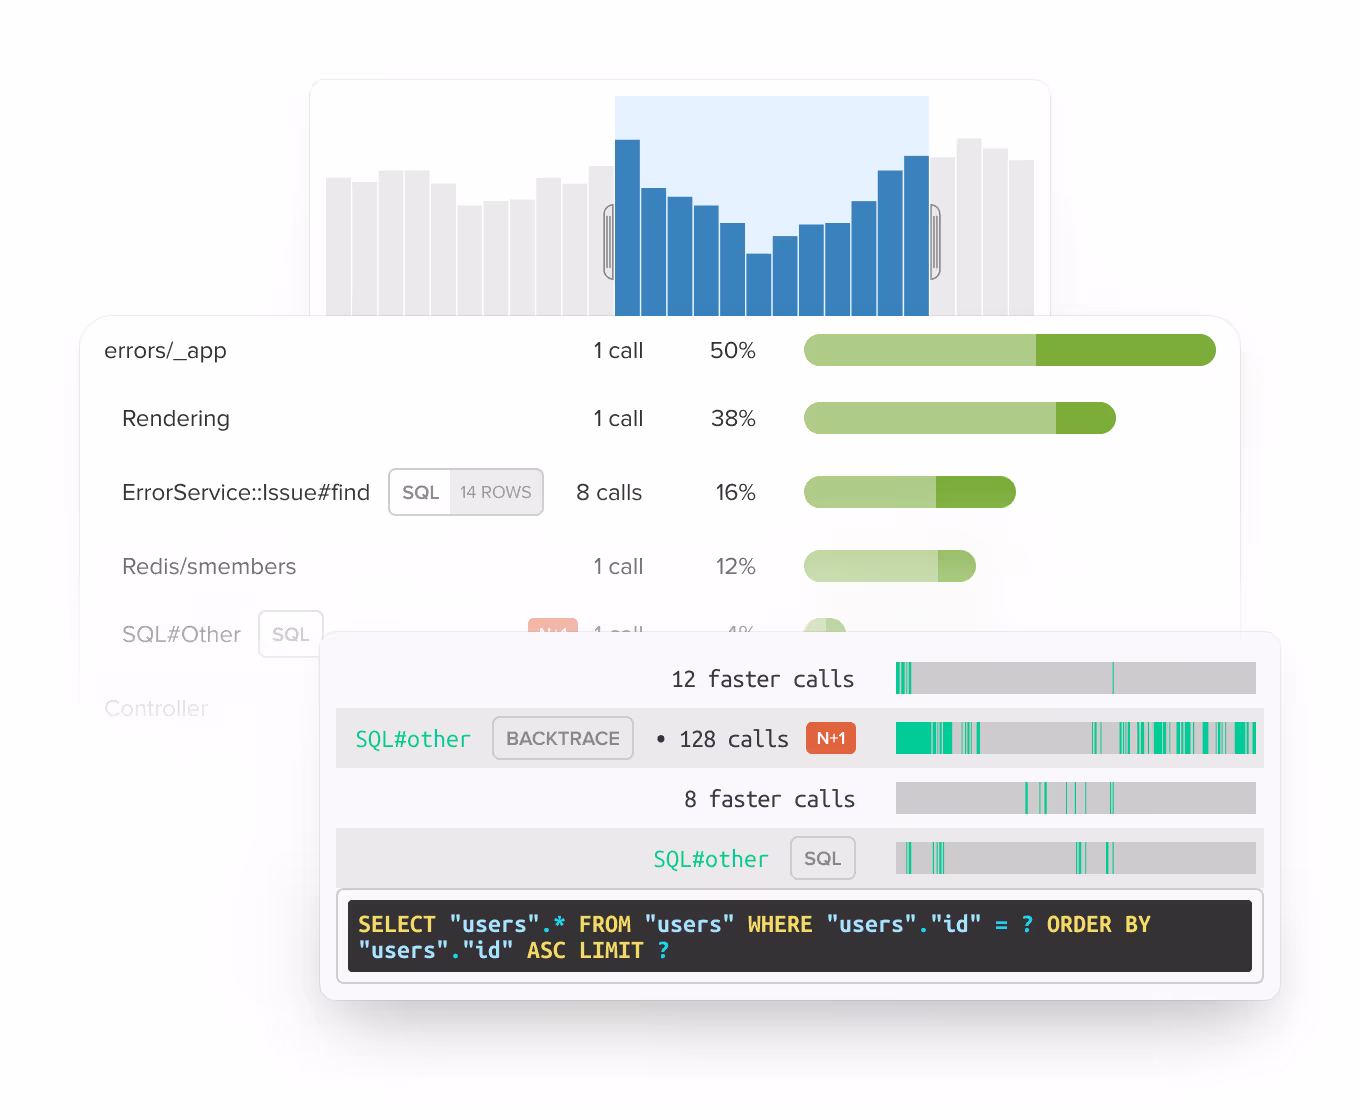
Automatic N+1 detection, memory bloat identification, and code-level traces. Free tier included.
Your app runs on DigitalOcean. Your monitoring should too.
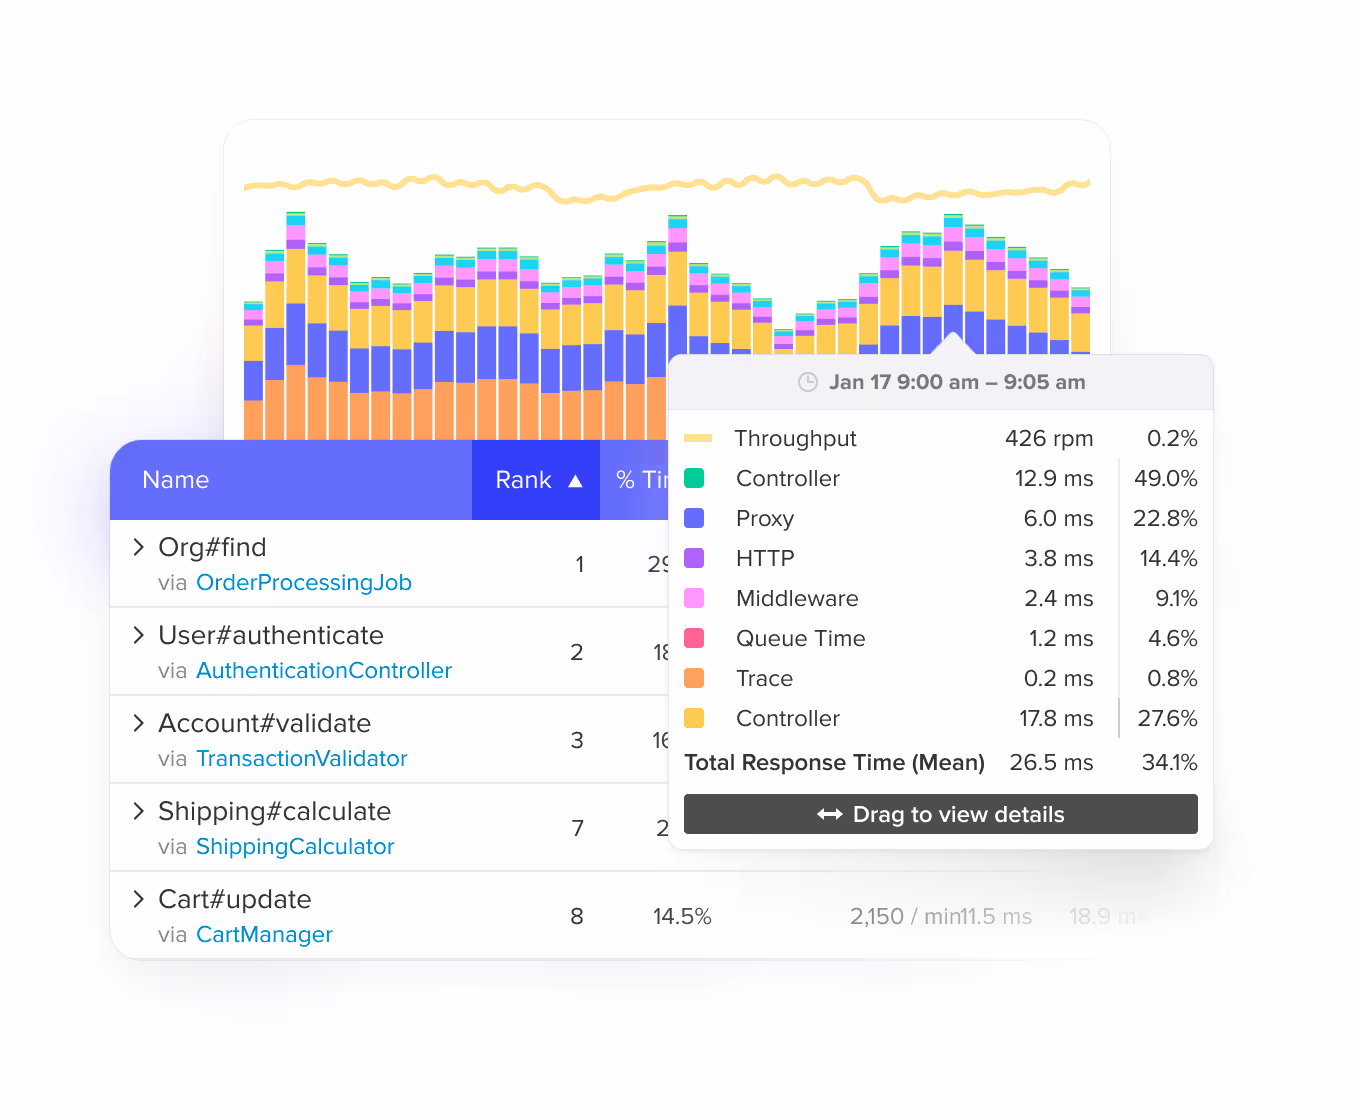
Whether you are running on App Platform, Droplets, or DigitalOcean Kubernetes, Scout monitors your application code and shows you where time is spent. Subscribe through the DigitalOcean Marketplace to keep monitoring on the same bill as your infrastructure. No separate vendor account, no separate procurement process.
Code-level answers for the problems DigitalOcean metrics do not show
DigitalOcean's monitoring shows CPU, memory, disk, and bandwidth at the infrastructure level. Scout shows you why your application is slow. Automatic N+1 detection finds the database queries running inside loops. Memory bloat detection identifies which code paths are growing memory. You get the exact code location and performance impact, not just a graph that says something is wrong.
Errors, logs, and traces in one tool
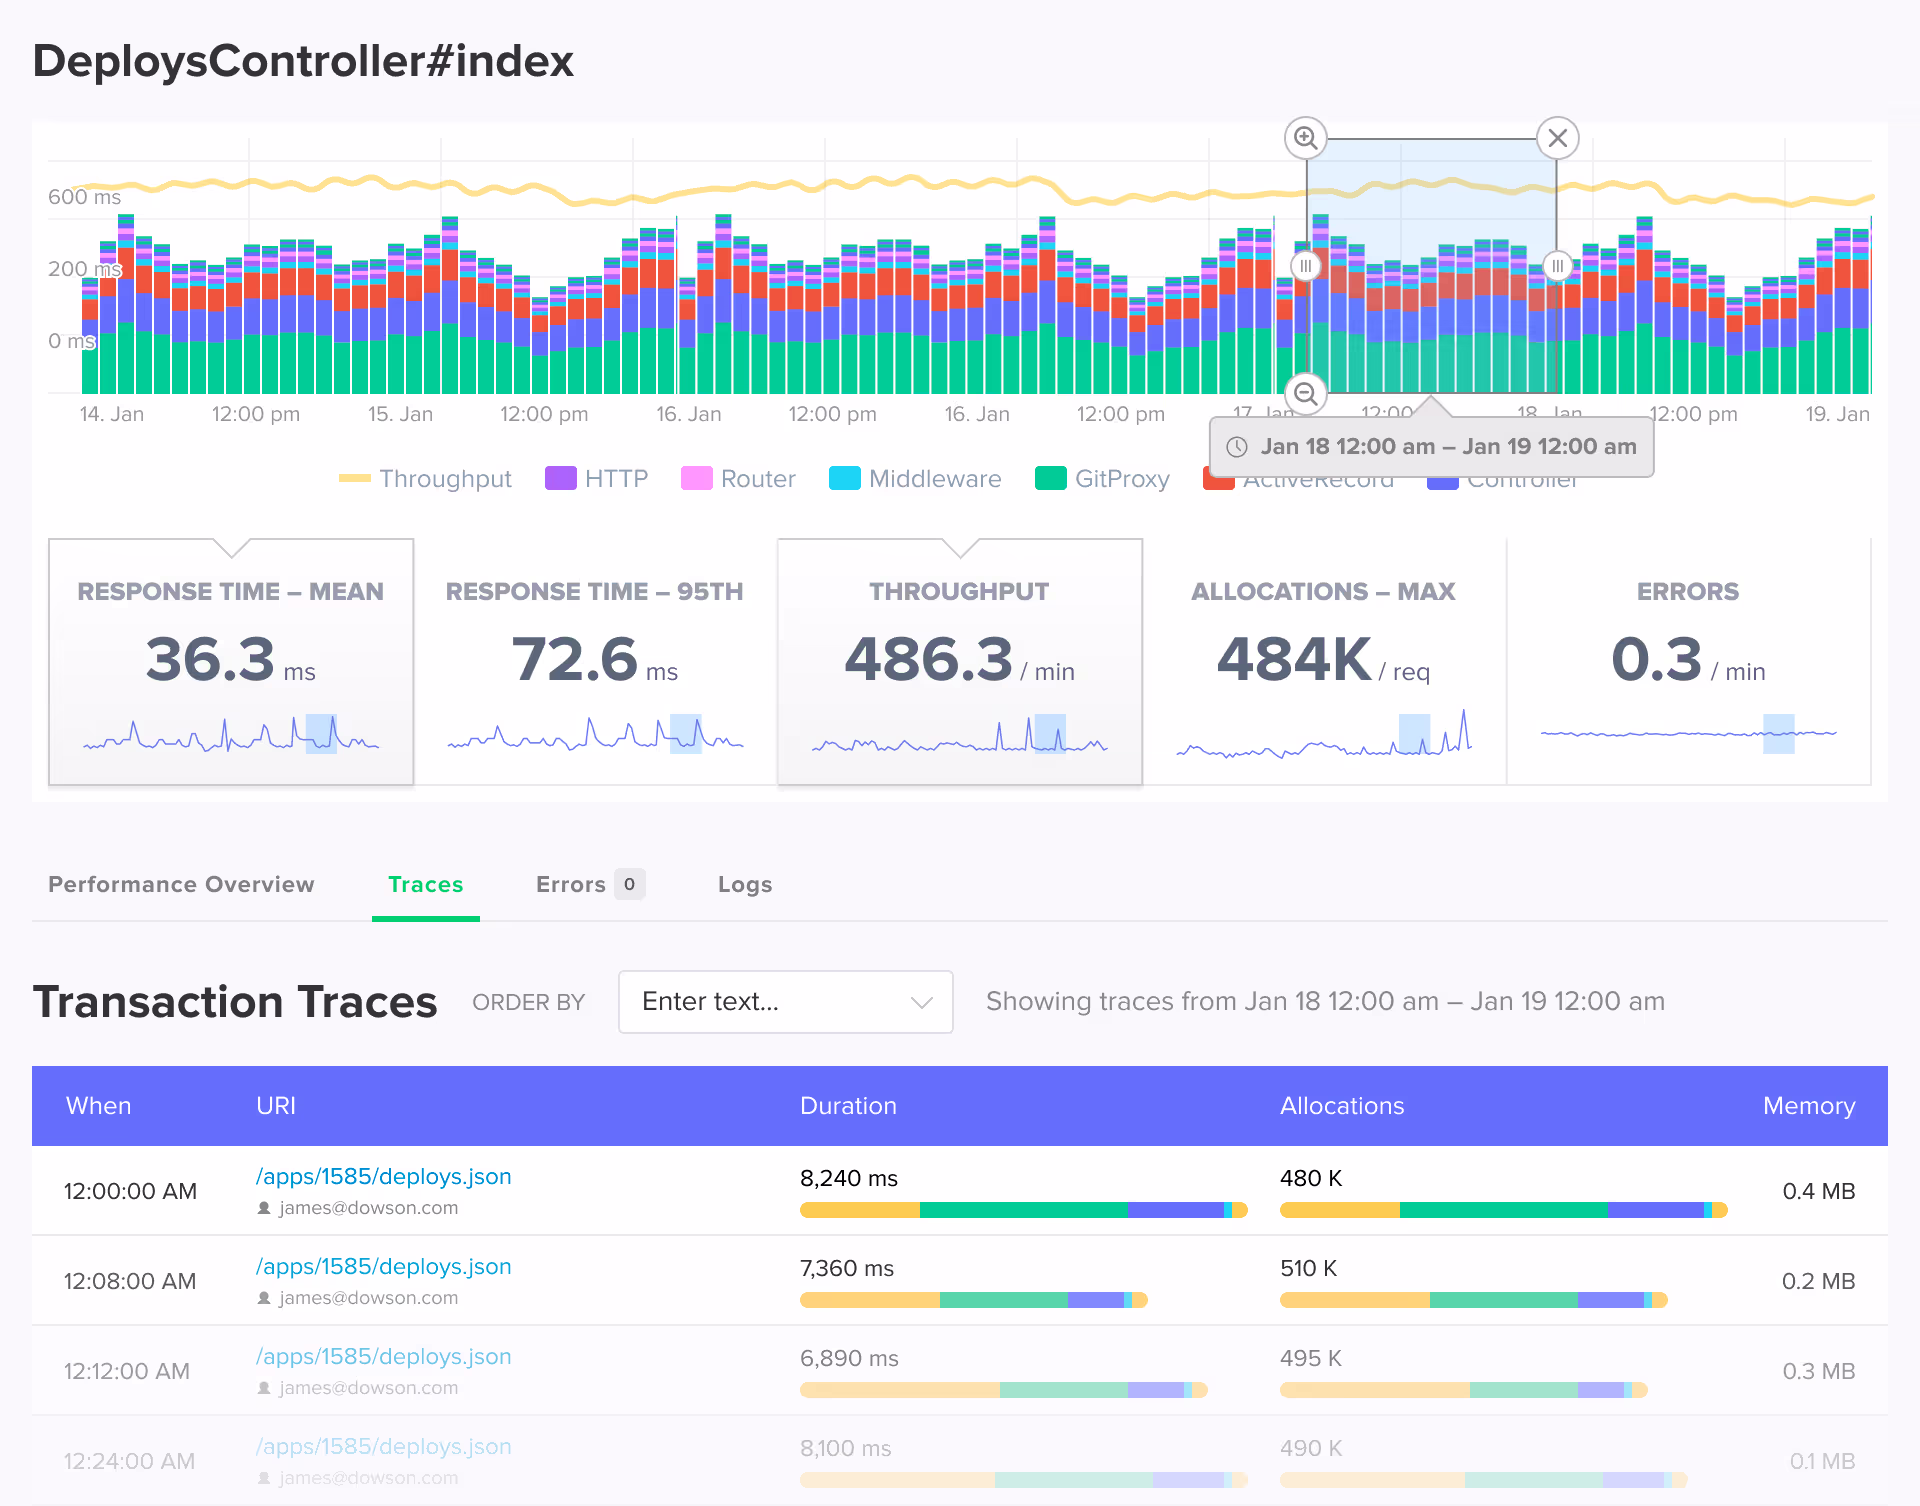
When something breaks, you see the exception, the request trace, and the surrounding log lines together. No juggling separate error trackers, APM tools, and log aggregators. Scout replaces three tools with one. Deploy markers show exactly when performance changed and which release caused it.
Pricing that scales with your app, not your infrastructure
Transaction-based pricing with errors and logs included at every tier. Start with the free tier (300,000 monthly transactions, 5,000 errors, 1 GB logs) and scale up as your application grows. No per-host fees, no seat licenses, no surprise bills when traffic spikes.
Query your app performance from Claude Code, Cursor, or the terminal
Scout's MCP server connects AI coding assistants to your error and trace data. The Scout CLI gives you terminal access. Both work the same whether you subscribed through DigitalOcean or signed up directly.
Built for developers who own production
DigitalOcean is popular with developers and small teams because it is simpler than the hyperscalers. Scout is built for the same audience. If your team ships features, handles deploys, and debugs production without a dedicated ops group, Scout gives you the monitoring answers you need without the platform complexity you do not.
Add Scout to Your DigitalOcean App
Get Scout running on your DigitalOcean-hosted app in under 5 minutes.
Subscribe through the DigitalOcean Marketplace.
Add Scout to your project:
# Rails
gem 'scout_apm'

# Python / Django / Flask
pip install scout-apm

# PHP / Laravel
composer require scoutapp/scout-apm-laravel

# Elixir / Phoenix
{:scout_apm, "~> 2.0"}Configure your API key and deploy. Data starts flowing within minutes.
Your Monitoring FAQ
How do I add Scout to my DigitalOcean app?
Subscribe through the DigitalOcean Marketplace at marketplace.digitalocean.com/add-ons/scout-monitoring. Then add the Scout agent to your application code (gem, pip package, or Composer dependency), configure your API key, and deploy. Data starts flowing within minutes.
Does Scout work with DigitalOcean App Platform?
Yes. Scout monitors your application code regardless of how it is deployed on DigitalOcean. App Platform, Droplets, and DigitalOcean Kubernetes all work. Scout instruments your application, not your infrastructure.
What languages does Scout support?
Scout supports Ruby (Rails, Sinatra, Grape, Sidekiq), Python (Django, Flask, FastAPI, Celery), PHP (Laravel, Symfony), and Elixir (Phoenix, LiveView, Oban). All agents work with DigitalOcean-hosted applications.
How is Scout billed through DigitalOcean?
Scout is billed through your DigitalOcean account as part of your monthly invoice. Plans start with a free tier (300,000 monthly transactions) and scale up based on usage. You can change plans at any time.
What is the difference between DigitalOcean's built-in monitoring and Scout?
DigitalOcean monitoring shows infrastructure metrics: CPU, memory, disk, and bandwidth. Scout shows application-level detail: which endpoint is slow, which database query is causing it, which background job is leaking memory, and which deploy introduced the problem. They work together.
Do I need a separate Scout account?
No. Subscribing through the DigitalOcean Marketplace creates your Scout account. Your monitoring is managed and billed through DigitalOcean.
Can I switch from DigitalOcean billing to a direct Scout plan?
Yes. If you want to consolidate billing or need a plan not available on the marketplace, you can switch to a direct Scout plan at any time. Contact us for help with the transition.
Does Scout support managed databases on DigitalOcean?
Scout monitors the database queries your application makes, regardless of where the database is hosted. If your app uses a DigitalOcean Managed Database (PostgreSQL, MySQL, Redis), Scout traces the queries hitting it and identifies slow queries, N+1 patterns, and connection issues.