Node.js Performance Monitoring
Errors and traces for your Express and NestJS applications. Scout's Node.js agent automatically instruments your code and detects N+1 queries in Prisma and raw SQL. Requires Node.js 18+ on Linux or macOS.
Three signals, one view for Node.js apps
Scout connects errors and transaction traces for your Node.js application in a single view. When an exception fires in Express or NestJS, you see the error and the full request trace together. No context-switching between tools.
Error Monitoring
Automatic capture of uncaught exceptions, unhandled promise rejections, and errors passed to Express error handlers. Every error is linked to the request trace that produced it. Error monitoring is enabled by default and you can filter specific exceptions with the errors_ignored_exceptions config. You can also call captureError() manually for cases where you handle errors in your own code.
App Traces
Transaction tracing with code-level visibility into Express route handlers and NestJS controllers. Detailed backtraces show the exact line of code responsible for slow responses.
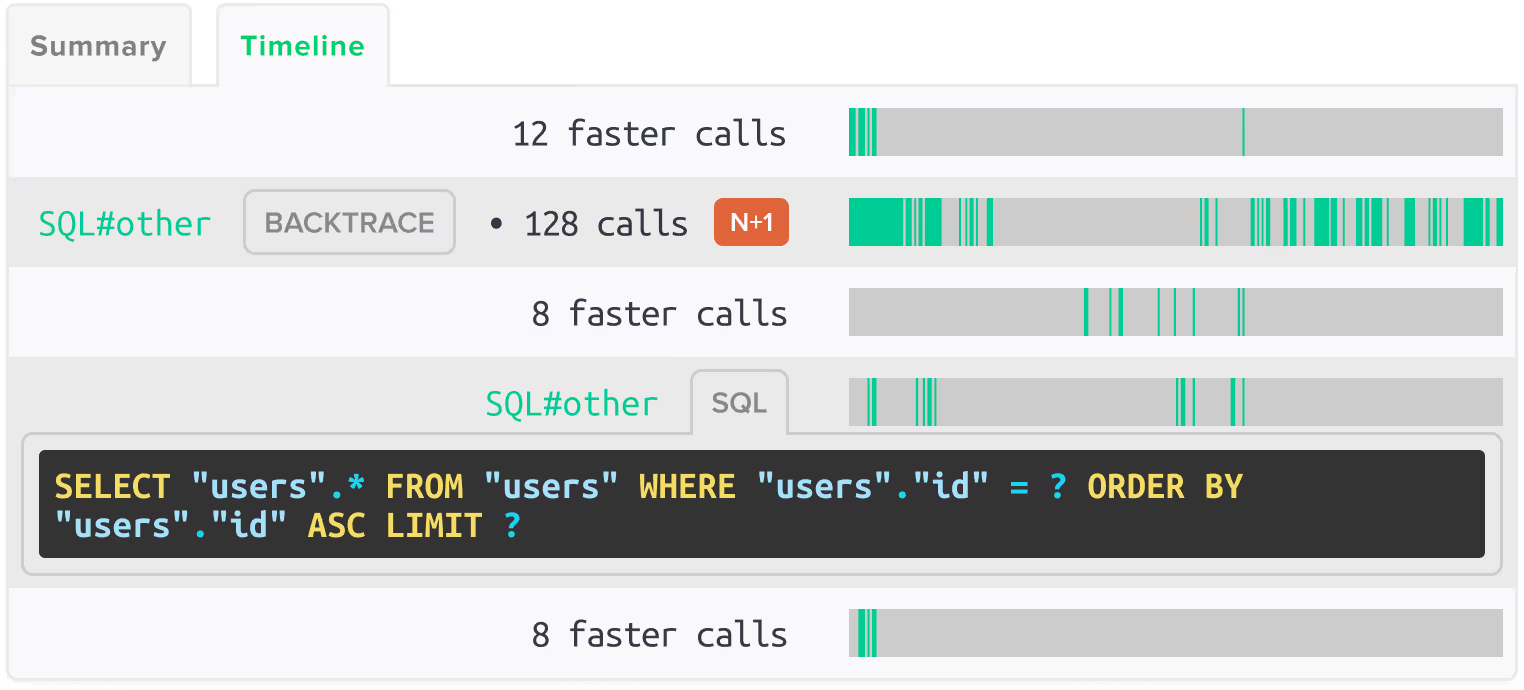
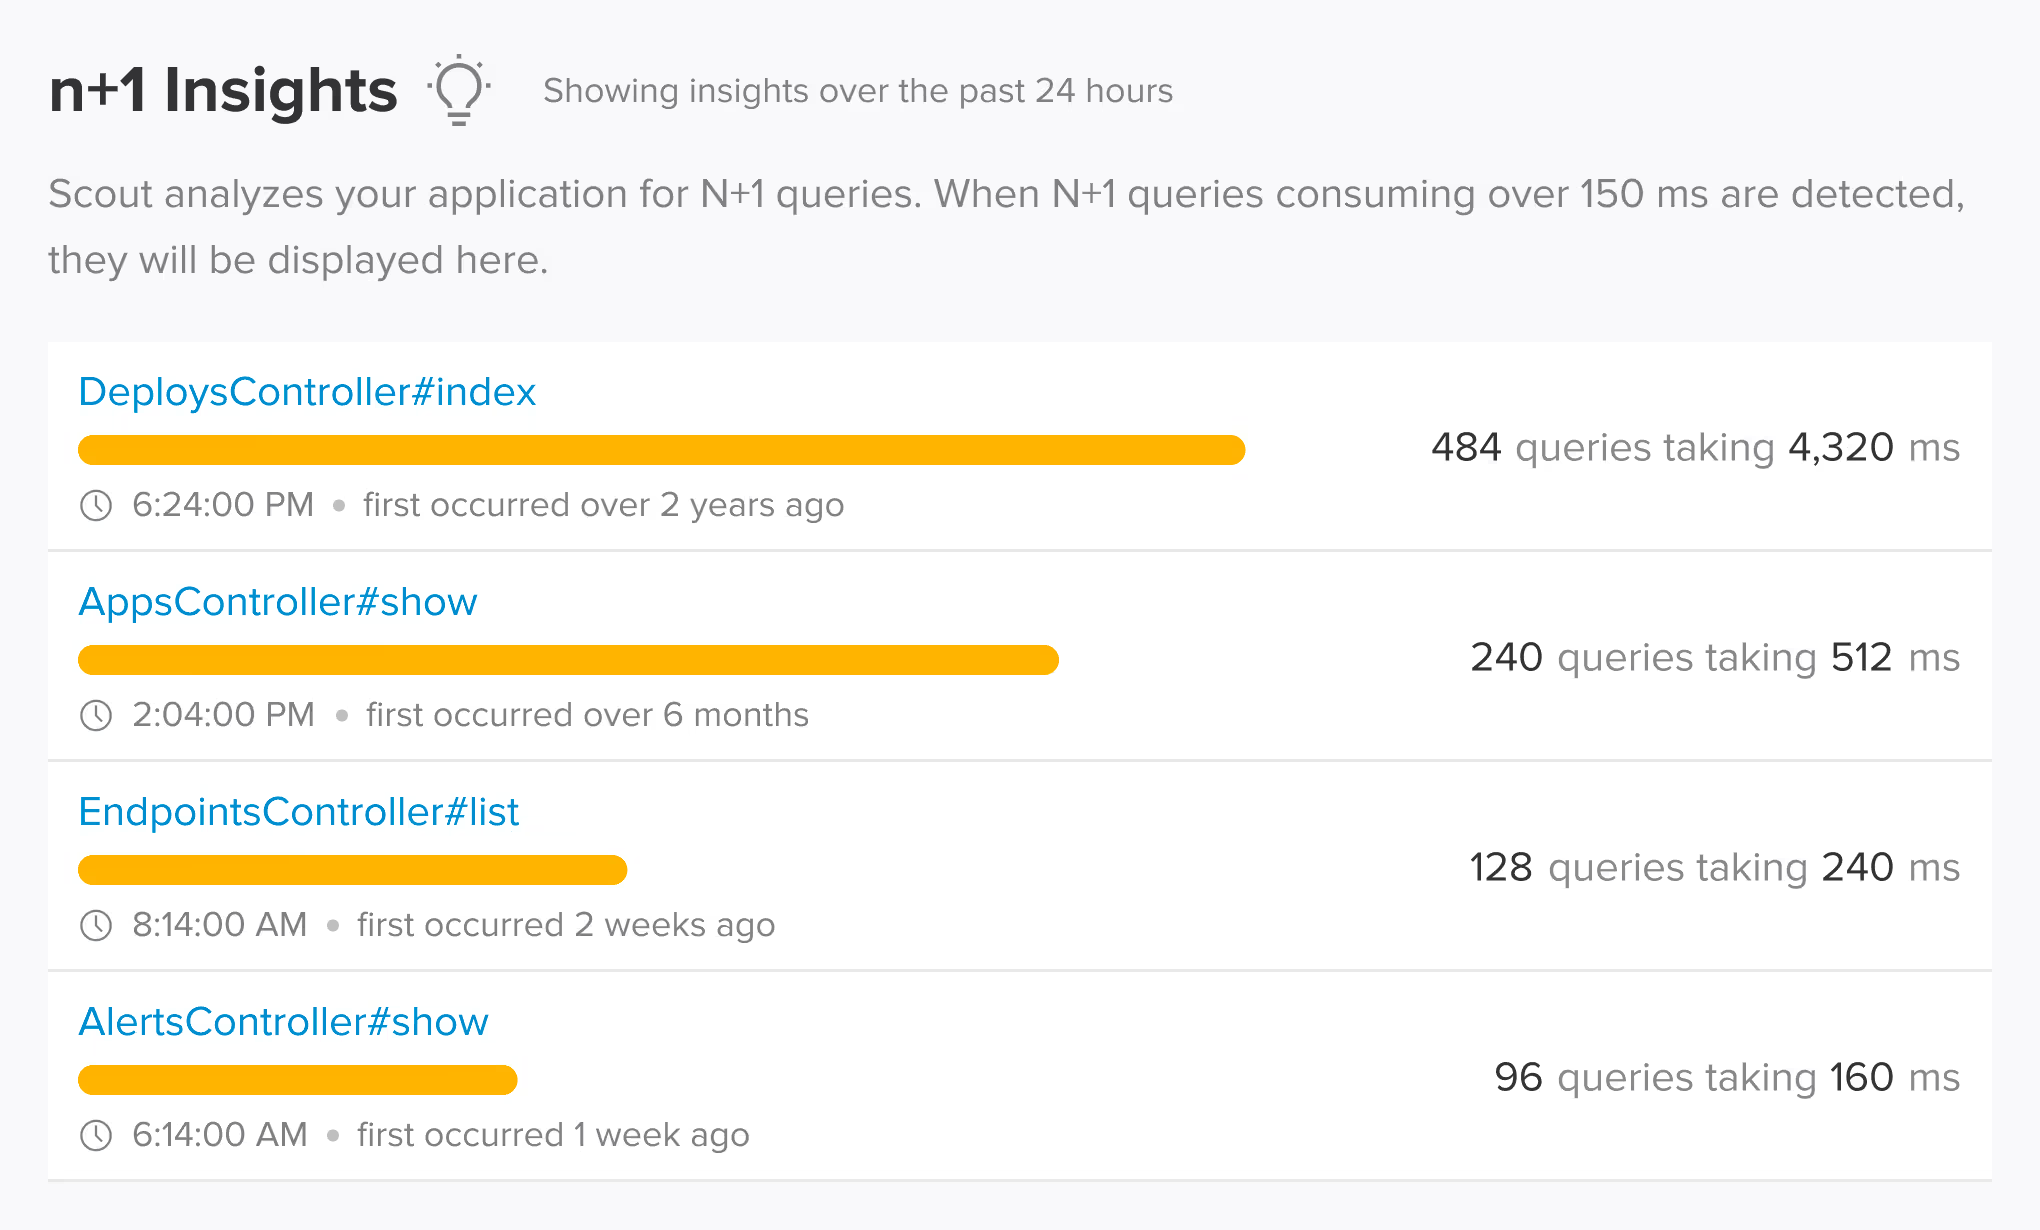
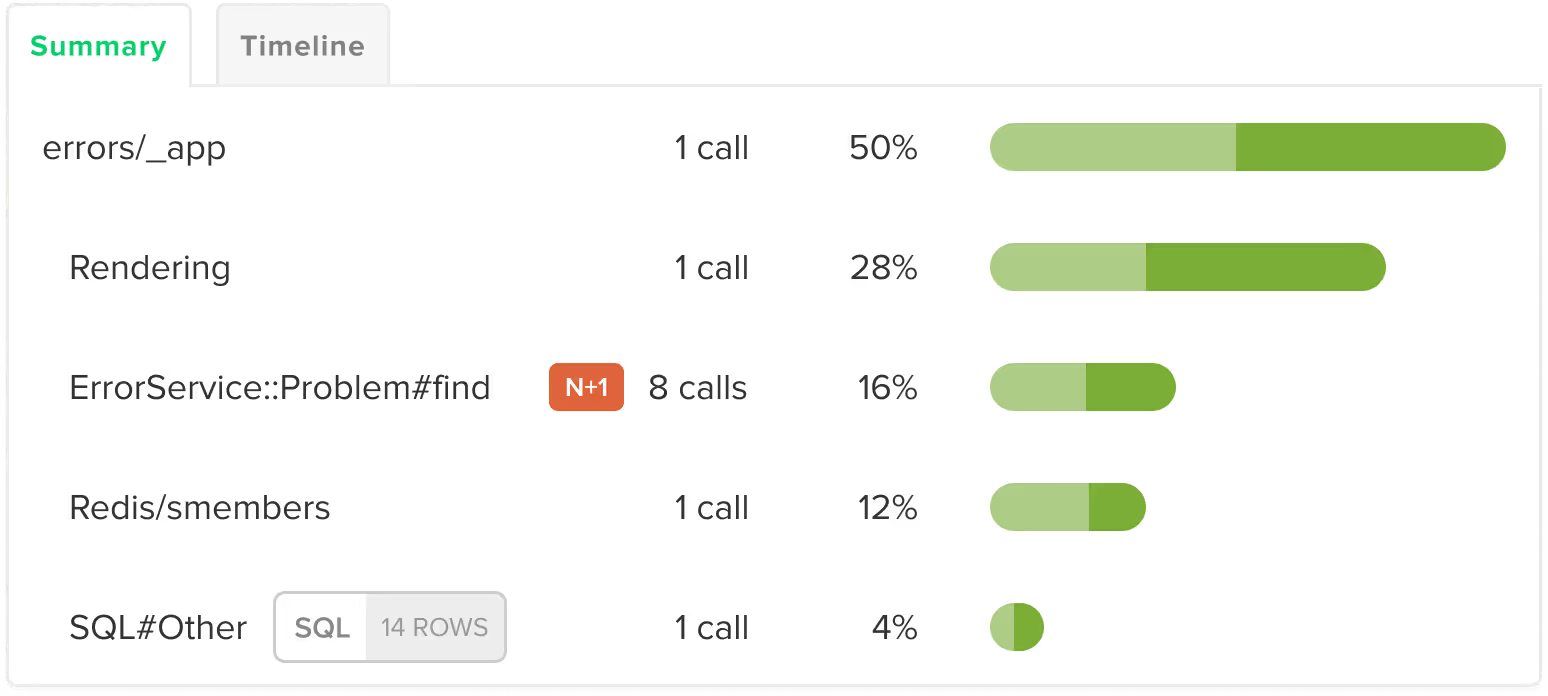
N+1 Detection and Query Analysis for Node.js
Scout automatically detects N+1 query patterns in Prisma and raw SQL without configuration. The agent monitors database queries across request handling and background jobs, identifying repeated query patterns and showing the exact code location and performance impact. Supports PostgreSQL (pg), MySQL (mysql, mysql2), and MongoDB.
What Scout instruments in your Node.js app
Scout auto-instruments the libraries your Node.js application already uses. Express 4/5 and NestJS 10+ are instrumented at the framework level. Prisma 6+, PostgreSQL (pg), MySQL (mysql, mysql2), MongoDB 4+, Redis (ioredis 5+, node-redis 5+), and HTTP calls via fetch, Axios, and the built-in http module are instrumented automatically with zero configuration. Template engines EJS, Pug, and Mustache are also covered.
Works with the Node.js frameworks you already use
Scout auto-instruments the frameworks and libraries in your stack. No manual configuration required.
Web Frameworks
- Express
- NestJS
Databases
- PostgreSQL (pg)
- MySQL (mysql/mysql2)
- MongoDB
ORMs & Query Builders
- Prisma
Caching
- ioredis
- node-redis
Other
- EJS
- Pug
- Mustache
- fetch, Axios, http
Query Your Node.js App Data from AI Assistants and the Terminal
Scout offers hosted and local MCP servers with 17 tools, a Go CLI via Homebrew with TOON format, and a public API. Query your Express or NestJS application's errors, traces, and query performance from your AI coding assistant or the terminal.
MCP Server
Hosted or local MCP server with 17 tools covering apps, endpoints, traces, errors, insights, background jobs, and usage data. Works with Claude Code, Cursor, VS Code Copilot, and any MCP-enabled assistant.
Scout CLI
Go binary available via Homebrew. Query app metrics, endpoint performance, traces, error groups, and insights from the terminal. Outputs human-friendly tables or TOON format for LLM consumption.
Public API
Full programmatic access to your monitoring data for building custom integrations, dashboards, or automation workflows.
Add Scout to Your Node.js App
Get started in under 3 minutes with our easy to install Node.js agent.
Install the package:
npm install @scout_apm/scout-apmCreate scout.js with your app name and key. Require it first in your entry point, before other packages.
Add middleware: Express uses expressMiddleware() and errorMiddleware(). NestJS uses nestMiddleware() and nestErrorFilter().
Set environment variables: SCOUT_MONITOR=true, SCOUT_KEY, SCOUT_NAME.
Deploy and see data in 5 minutes.
Node.js Monitoring FAQ
What is the best APM for Node.js?
Scout Monitoring provides integrated errors and traces for Node.js applications built with Express and NestJS. The Node.js agent includes N+1 detection and query analysis across Prisma and raw SQL, and auto-instrumentation for databases, caches, and HTTP calls. Scout is built for development teams that want all their monitoring signals in one place without enterprise complexity.
What is the best monitoring tool for Express?
Scout auto-instruments Express 4 and 5 with zero configuration. You get request tracing through route handlers and middleware, automatic error capture, and N+1 detection and query analysis across Prisma and raw SQL. Errors are linked to traces in a single view. Install the @scout_apm/scout-apm package, add the Express middleware, and deploy.
How does Scout detect N+1 queries in Node.js?
Scout automatically detects N+1 query patterns within Express routes and NestJS controllers. Each query is captured with execution time and the code location that triggered it. Repeated query patterns are flagged so you can fix them before they cause performance problems. Prisma 6+, PostgreSQL (pg), MySQL (mysql, mysql2), and MongoDB are all supported.
What is the best error monitoring for NestJS?
Scout captures uncaught exceptions, unhandled promise rejections, and errors thrown in NestJS controllers and services automatically. Each error is linked to the request trace. Import the ScoutModule into your NestJS application to get started. You can also call captureError() for errors you catch and handle yourself.
Can I use my AI coding assistant with Scout for Node.js apps?
Yes. Scout offers hosted and local MCP servers with 17 tools that work with Claude Code, Cursor, VS Code Copilot, and any MCP-enabled assistant. You can query your Express or NestJS application's errors, traces, and query performance in natural language from your editor. The Scout CLI, available via Homebrew, gives you terminal access to the same data and outputs in TOON format for LLM consumption. There is also a public API for custom integrations.
How do I configure error monitoring for Node.js?
Error monitoring is enabled by default in the Node.js agent (errors_enabled is true). To disable it, set errors_enabled to false in your Scout config or set the SCOUT_ERRORS_ENABLED environment variable. You can filter out specific exception types with the errors_ignored_exceptions config option, which accepts an array of exception class names that Scout will not report.
How do I track deploys with Scout for Node.js?
Set the revision_sha config option to your current Git commit SHA. Scout will tie traces and errors to that specific deploy, so you can see when a performance regression or new error was introduced.
Can I filter out health check endpoints in Scout?
Yes. Use the ignore config option to specify endpoints that Scout should not trace. This is useful for health check routes like /health or /ping that generate noise in your monitoring data.
How does Scout compare to Datadog and New Relic for Node.js?
Datadog and New Relic are full-platform observability tools built for operations teams managing large infrastructure. Scout is built for dev teams running Express and NestJS applications. Scout includes automatic N+1 detection in Prisma, integrated error monitoring, and MCP server access for AI-assisted development. Pricing starts at $19/month with no per-seat fees. If your team does not have dedicated DevOps and you want answers without building dashboards, Scout is a better fit.
Does Scout work with Heroku for Node.js?
Yes. The Heroku addon automatically configures SCOUT_MONITOR and SCOUT_KEY. You only need to set SCOUT_NAME to identify your application.