Prisma Performance Monitoring
N+1 detection, slow query analysis, and per-operation timing for Prisma. Scout's Node.js agent instruments Prisma 6+ natively via traceparent. Every findMany, create, update, and raw query is captured with timing and caller location. N+1 query patterns are detected automatically. No manual middleware required.
Errors and Traces for Every Prisma Query
Scout connects Prisma query failures to the full request trace in a single view. When a query throws a PrismaClientKnownRequestError or a connection times out, you see the error and the request trace with timing for every operation together.
Error Monitoring
Automatic capture of Prisma client errors including constraint violations, connection failures, and query timeouts. Every error is linked to the request trace that triggered it and enriched with the model and operation context. You can also call captureError() for errors you handle in your own code.
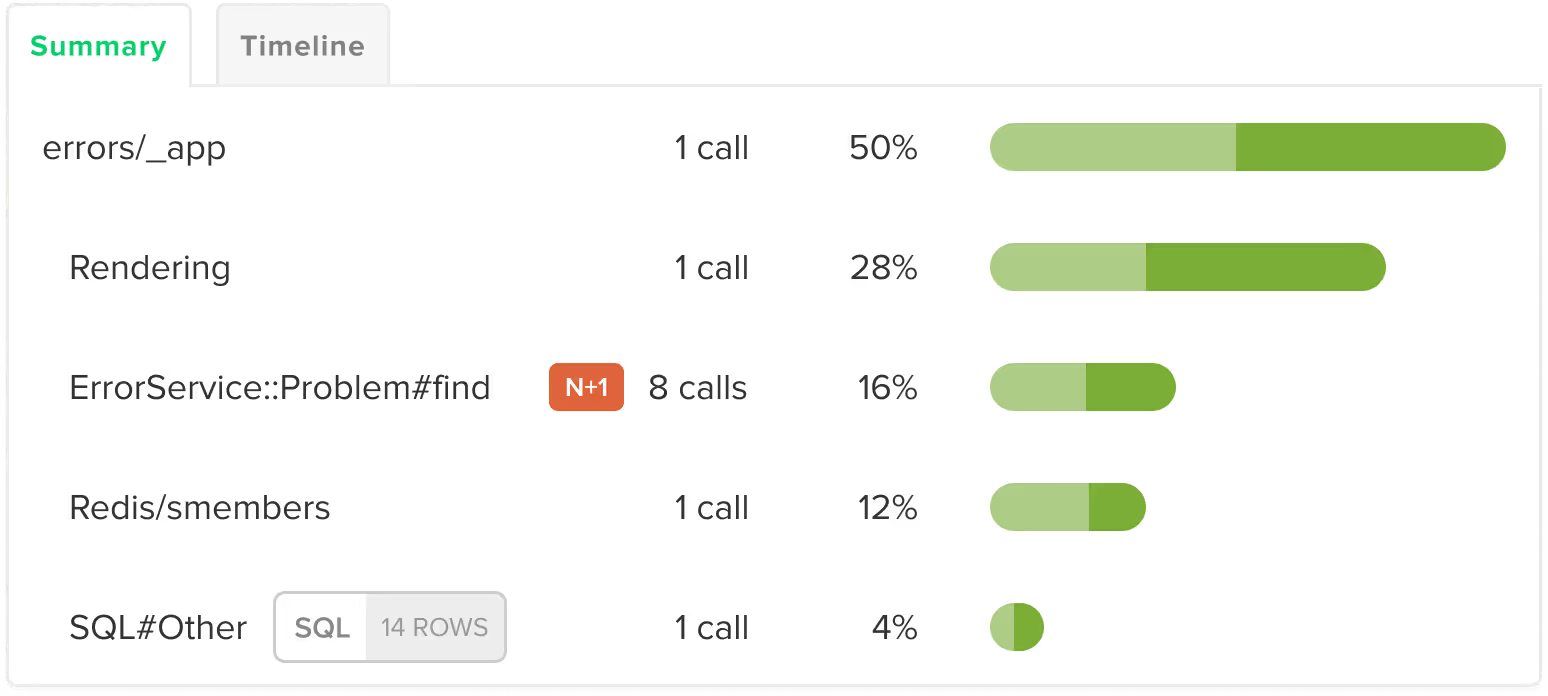
App Traces
Every Prisma operation appears in the request trace with timing: findMany, findUnique, create, update, delete, aggregate, raw queries, and transactions. You see database time broken out by model and operation within each request, not just a total query count.
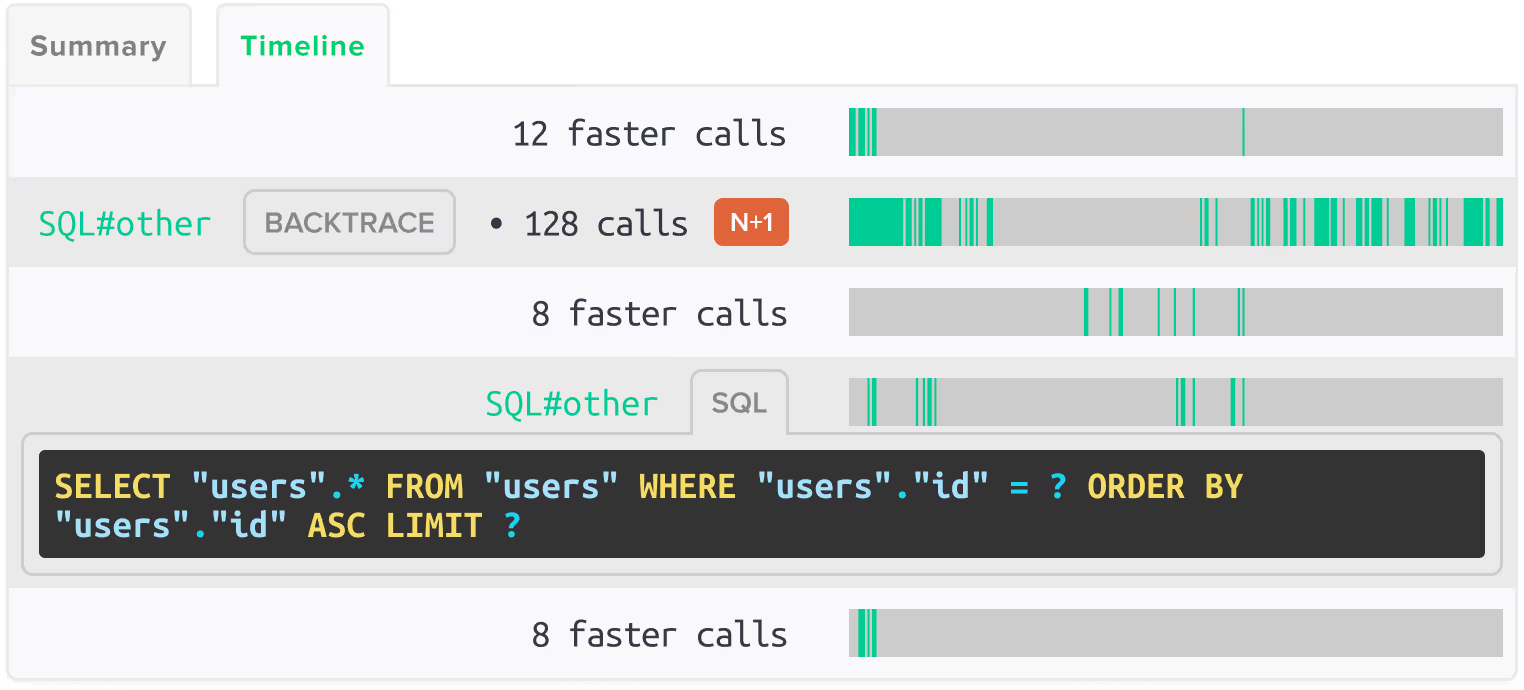
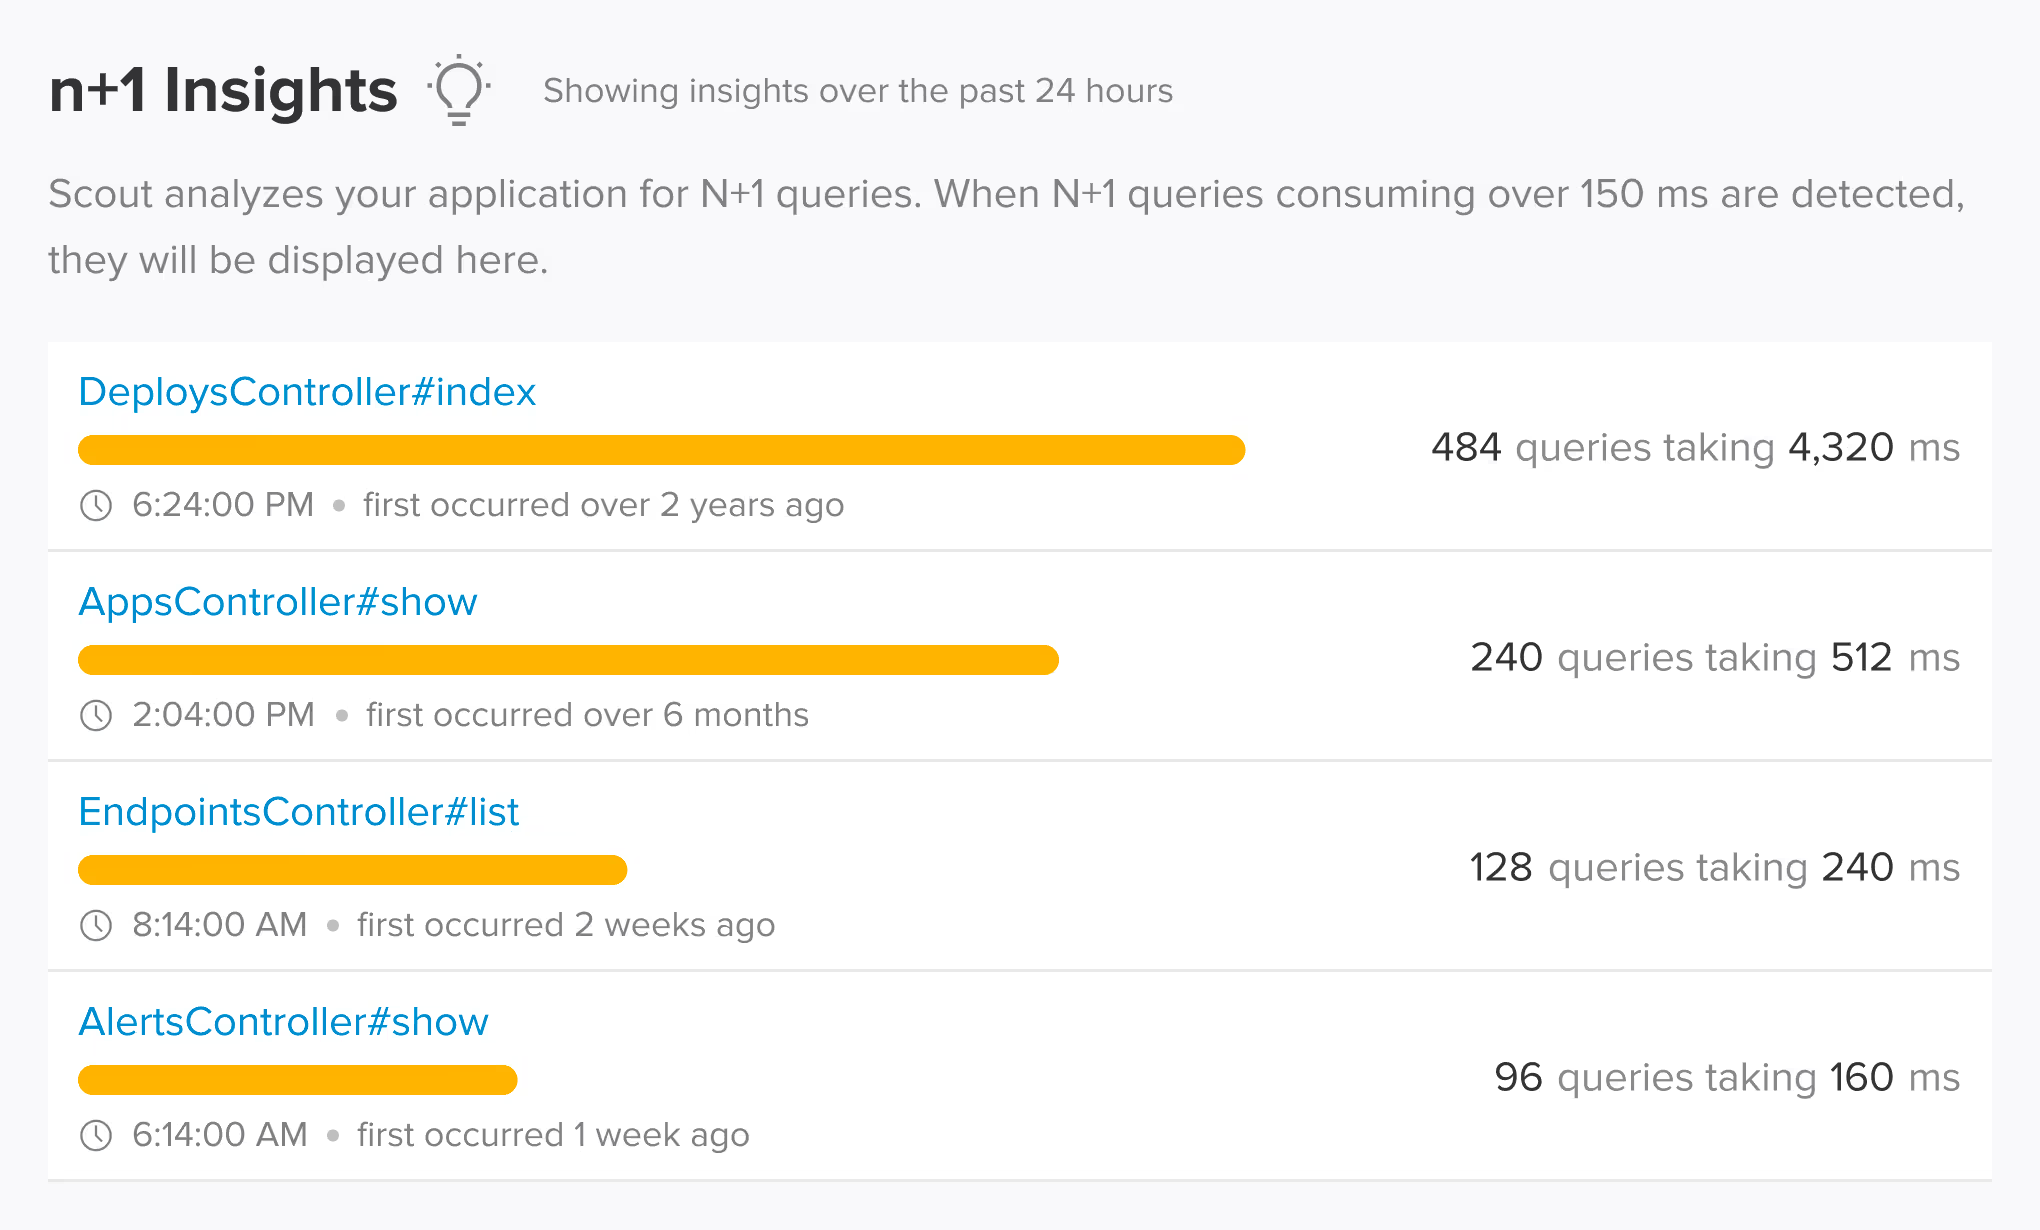
N+1 Detection and Query Analysis for Prisma
Scout automatically detects N+1 query patterns in Prisma and raw SQL without configuration. The agent monitors database queries across Express routes and NestJS controllers, identifying repeated query patterns and showing the exact code location and performance impact. You can sort by slowest queries to find the biggest bottlenecks across your application. This gives you query-level visibility into Prisma performance without middleware or manual instrumentation.
Prisma 6+ Instrumented via Native Tracing
Scout uses Prisma 6+ native tracing via the traceparent header to capture every database operation without middleware or manual spans. Prisma Client operations, connection pool metrics, and raw queries are all covered. PostgreSQL, MySQL, MongoDB, and SQLite databases accessed through Prisma are instrumented at the driver level.
Works with the Prisma frameworks you already use
Scout auto-instruments the frameworks and libraries in your stack. No manual configuration required.
Prisma Client
- findMany
- findUnique
- create
- update
- delete
- aggregate
- $queryRaw
- $executeRaw
- Transactions
Databases
- PostgreSQL
- MySQL
- MongoDB
- SQLite
Frameworks
- Express
- NestJS
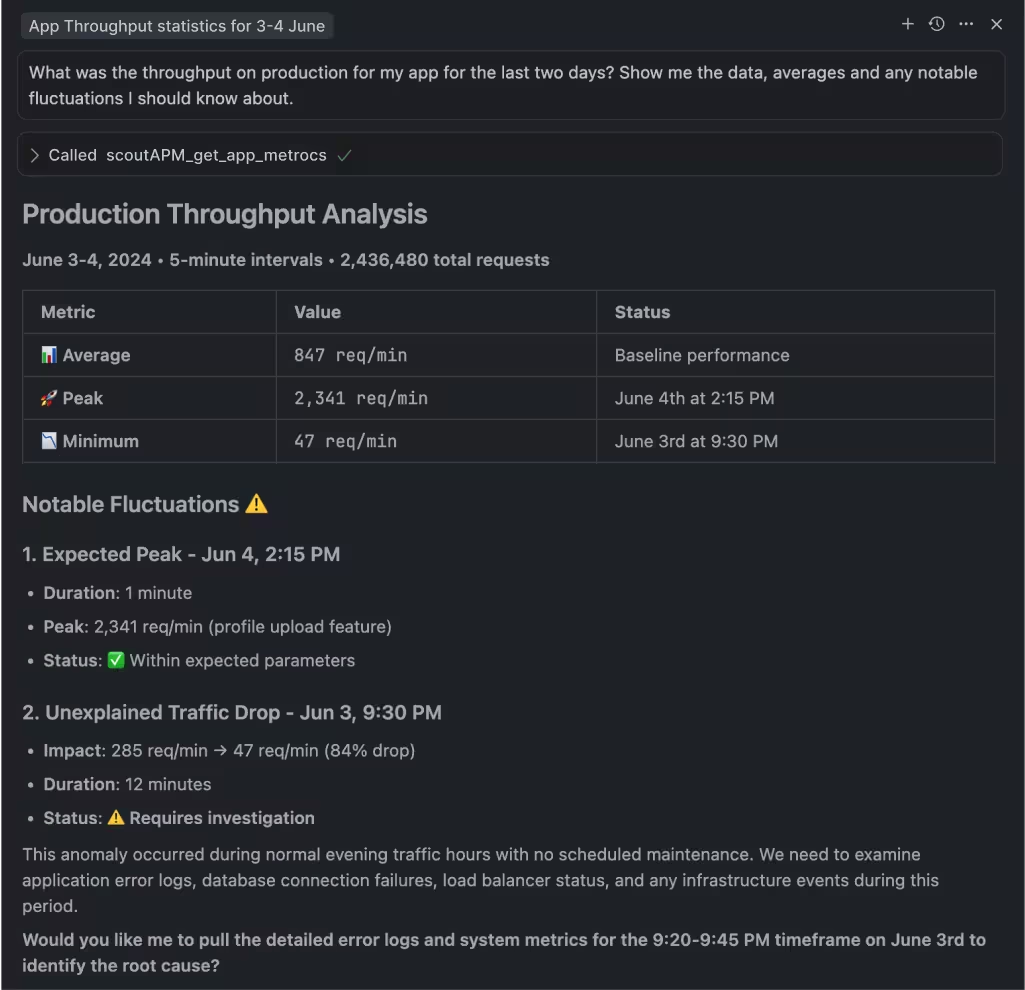
Query Your Prisma App Data from AI Assistants and the Terminal
Scout offers hosted and local MCP servers with 17 tools, a Go CLI available via Homebrew with TOON format for LLM output, and a public API. Query your Prisma slow queries, error rates, and query performance from Claude Code, Cursor, or the terminal.
MCP Server
Hosted or local MCP server with 17 tools covering apps, endpoints, traces, errors, insights, background jobs, and usage data. Works with Claude Code, Cursor, VS Code Copilot, and any MCP-enabled assistant.
Scout CLI
Go binary available via Homebrew. Query app metrics, endpoint performance, traces, error groups, and insights from the terminal. Outputs human-friendly tables or TOON format for LLM consumption.
Public API
Full programmatic access to your monitoring data for building custom integrations, dashboards, or automation workflows.
Add Scout to Your Prisma App
Get Scout running with Prisma in under 3 minutes.
Install the package:
npm install @scout_apm/scout-apmCreate scout.js with your app name and key. Require it first in your entry point. Prisma 6+ is detected and instrumented automatically.
Add your framework middleware (Express or NestJS) as described in the setup guide.
Set environment variables: SCOUT_MONITOR=true, SCOUT_KEY, SCOUT_NAME.
Deploy and see data in 5 minutes.
Prisma Monitoring FAQ
How does Scout trace Prisma queries?
Scout instruments Prisma 6+ via native tracing (traceparent) and captures every query with execution time and the code location that triggered it. N+1 query patterns are detected automatically. You can sort by slowest queries to find the biggest performance bottlenecks. This works across Express routes and NestJS controllers.
What is the best performance monitoring for Prisma?
Scout Monitoring instruments Prisma 6+ via native tracing (traceparent), capturing every query with timing, model context, and caller location. N+1 query patterns are detected automatically and slow queries are surfaced with the exact code path that triggered them. Scout works across Express and NestJS.
How do I find slow Prisma queries?
Scout traces every Prisma operation (findMany, create, update, raw queries, transactions) with per-query timing. Slow queries are surfaced in the trace view with the model, operation, and the code location that triggered them. You can sort by total database time to find the most expensive queries across your application.
What is the best APM for Prisma?
Scout Monitoring provides N+1 detection, query-level tracing, and connection pool monitoring for Prisma 6+. The agent uses Prisma's native tracing support, so there is no middleware to configure. Prisma operations appear in request traces alongside other operations like HTTP calls and cache lookups.
Does Scout support Prisma with PostgreSQL and MySQL?
Yes. Scout instruments Prisma operations regardless of the underlying database. PostgreSQL, MySQL, MongoDB, and SQLite are all supported. Query timing is captured at both the Prisma Client level and the database driver level, giving you visibility into ORM overhead versus actual database execution time.
Does Scout monitor Prisma connection pools?
Yes. Scout tracks Prisma connection pool utilization so you can identify pool exhaustion before it causes request timeouts. Connection wait time is captured alongside query execution time, helping you determine whether slow queries are caused by the database or by waiting for an available connection.
Can I use Scout with Claude Code to debug Prisma performance?
Yes. Scout offers hosted and local MCP servers with 17 tools that work with Claude Code, Cursor, VS Code Copilot, and any MCP-enabled assistant. You can query your Prisma slow queries and error rates in natural language from your editor. The Scout CLI provides terminal access to the same data in TOON format.