NestJS Performance Monitoring
Errors and traces for your NestJS applications. Scout's Node.js agent automatically traces controllers and routes, detects N+1 queries in Prisma and raw SQL, and connects exceptions to the exact request context. Supports NestJS 10+ on Node.js 18+.
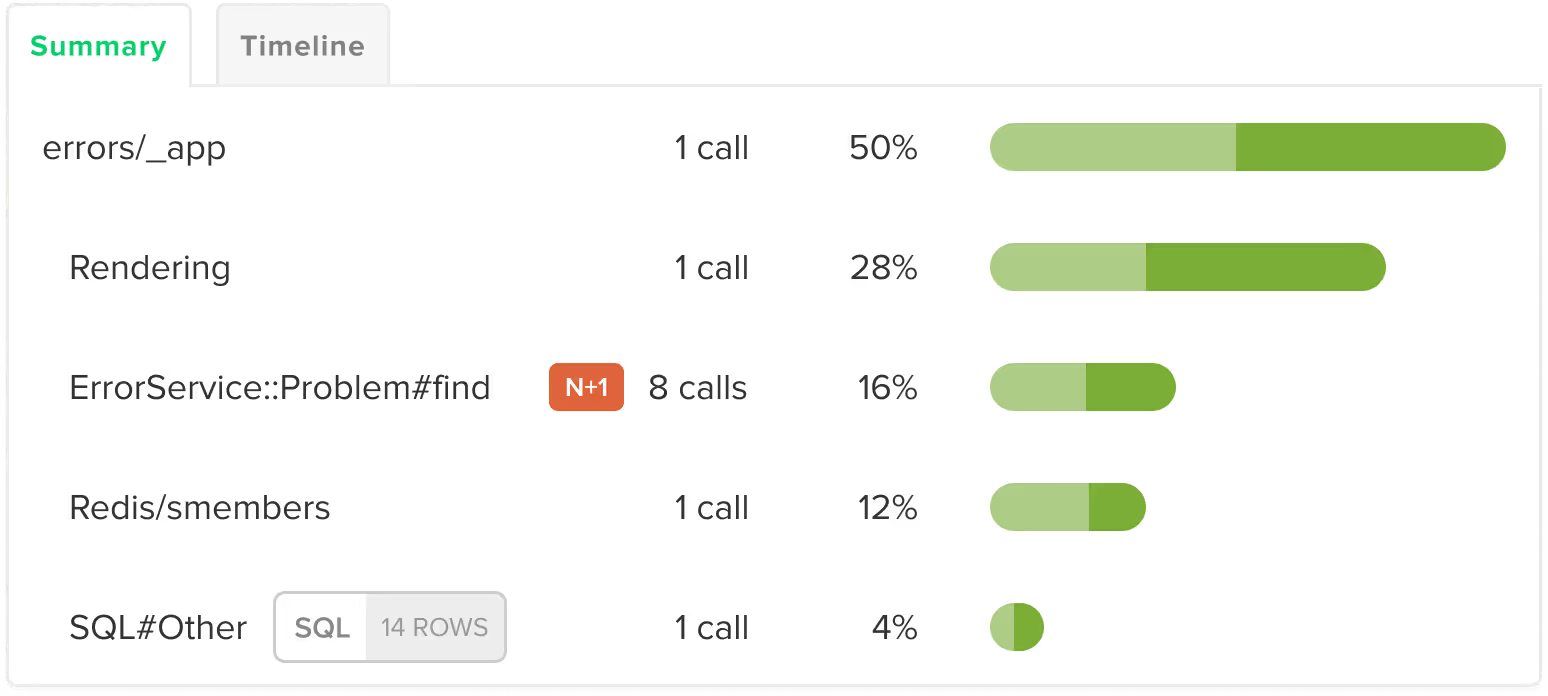
Errors and Traces in One View for NestJS Apps
Scout combines error monitoring and transaction tracing into a single view for your NestJS application. When a controller throws an exception, you see the error and the full request trace together.
Error Monitoring
Automatic capture of exceptions thrown in NestJS controllers and services. Every error is linked to the request trace that produced it. You can call captureError() for errors you handle in your own code.
App Traces
Transaction tracing with visibility into NestJS controllers and route handlers. Backtraces show the exact line of code responsible for slow responses. Database queries, cache operations, and external HTTP calls are broken out with per-operation timing.
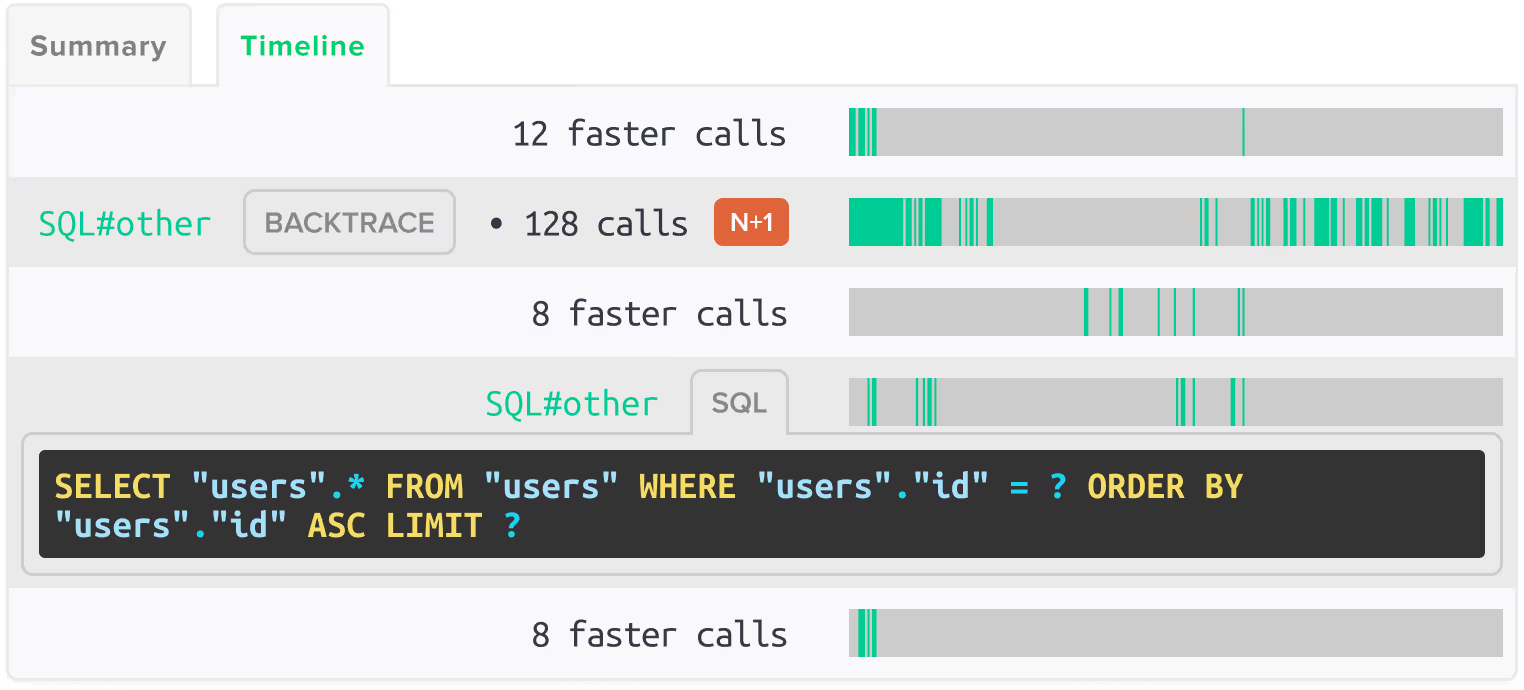
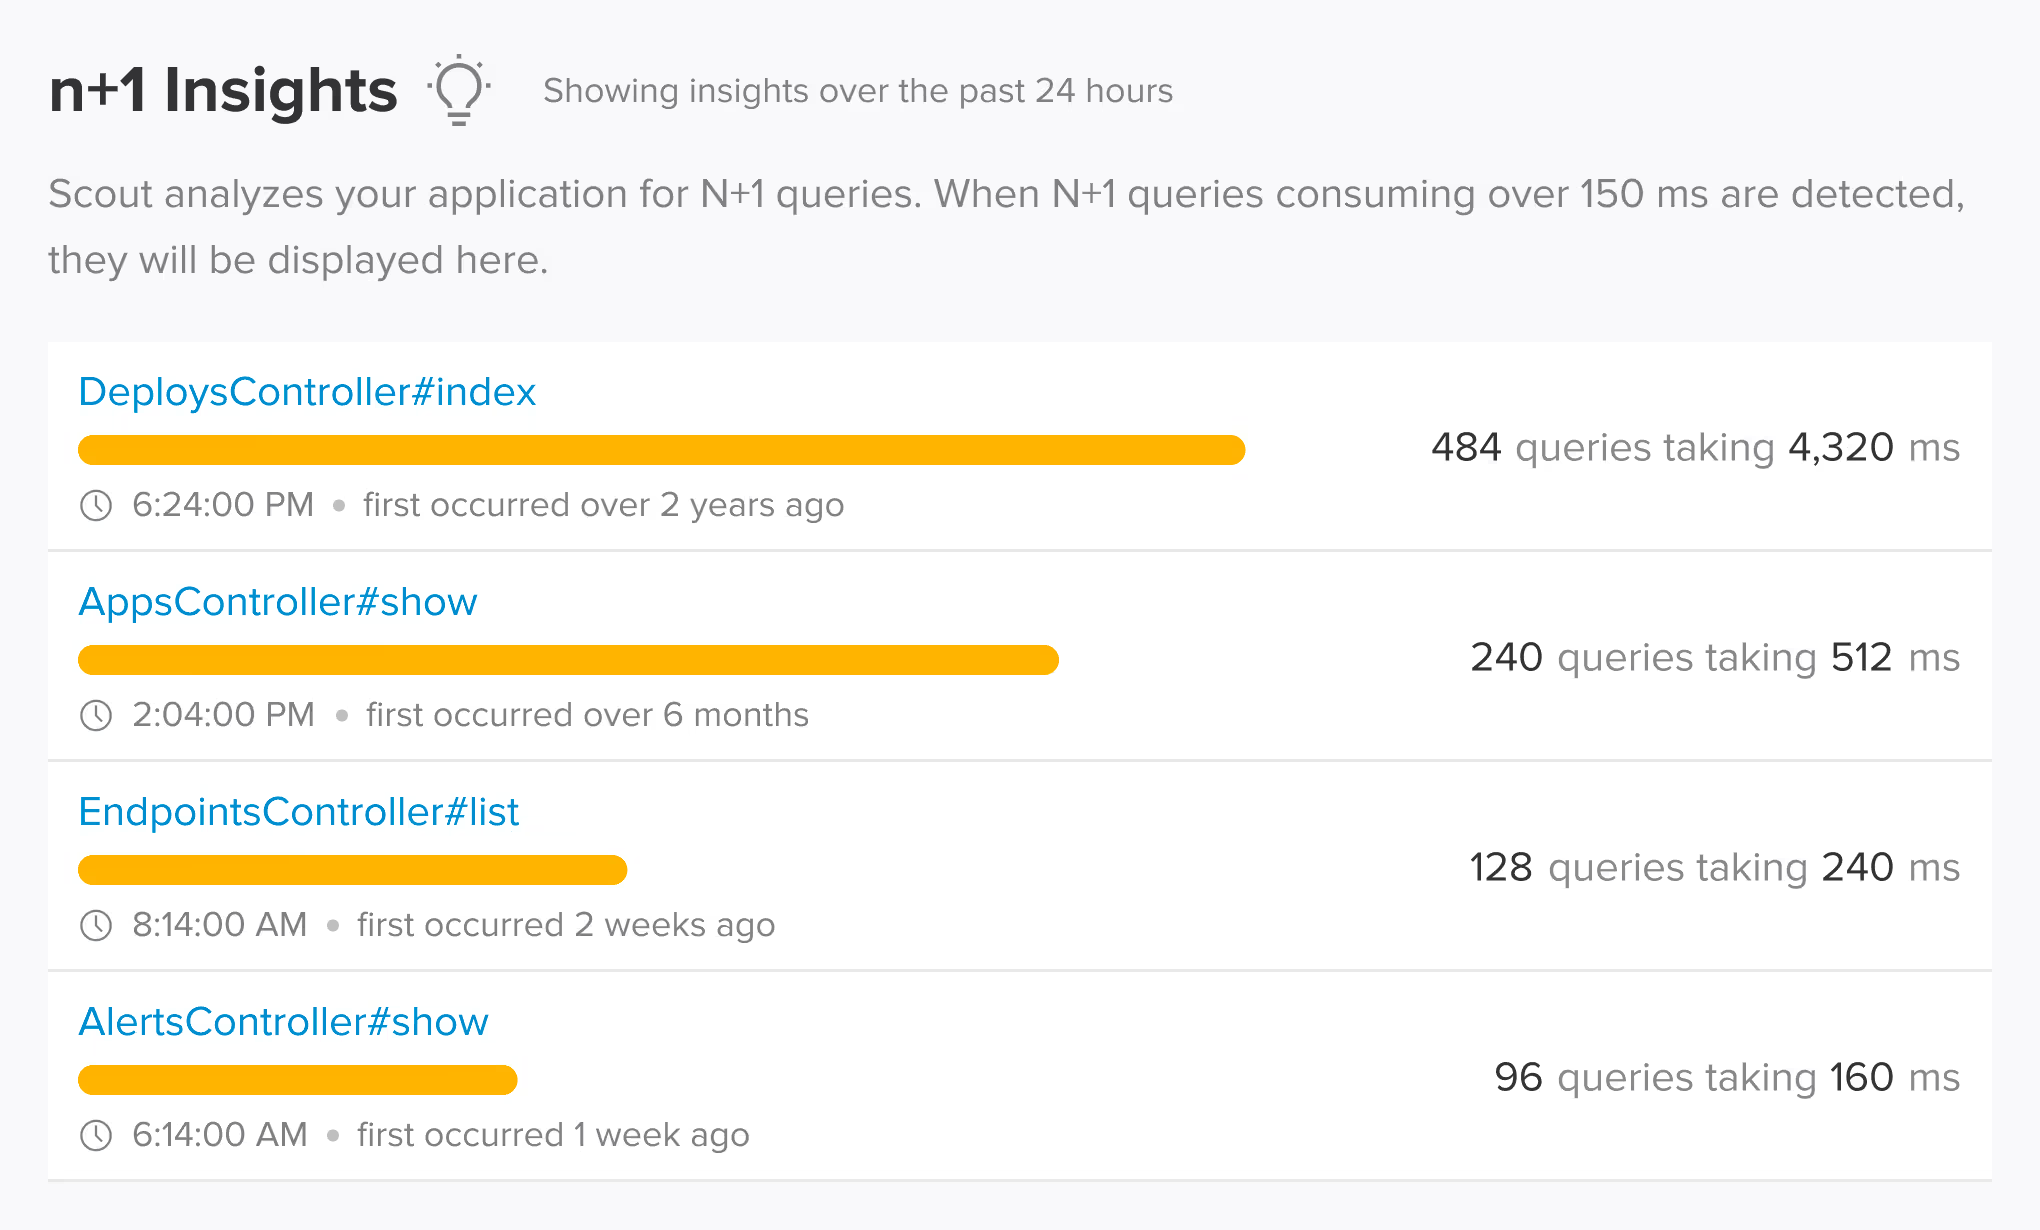
N+1 Detection and Query Analysis in Prisma and Raw SQL
Scout automatically detects N+1 query patterns in Prisma and raw SQL without configuration. The agent monitors database queries across NestJS controllers, services, and background jobs, identifying repeated query patterns and showing the exact code location and performance impact. Supports PostgreSQL (pg), MySQL (mysql2), and MongoDB.
Controllers, Prisma, and More Out of the Box
Scout auto-instruments the libraries your NestJS application already uses. Controllers and routing are covered at the framework level. Prisma 6+, PostgreSQL (pg), MySQL (mysql2), MongoDB 4+, ioredis 5+, and node-redis 5+ are instrumented automatically. HttpModule and Axios HTTP calls are captured with zero configuration.
Works with the NestJS frameworks you already use
Scout auto-instruments the frameworks and libraries in your stack. No manual configuration required.
NestJS Core
- Controllers
- Route Handlers
ORMs & Query Builders
- Prisma
Databases
- PostgreSQL (pg)
- MySQL (mysql2)
- MongoDB
Caching
- ioredis
- node-redis
HTTP Clients
- HttpModule
- Axios
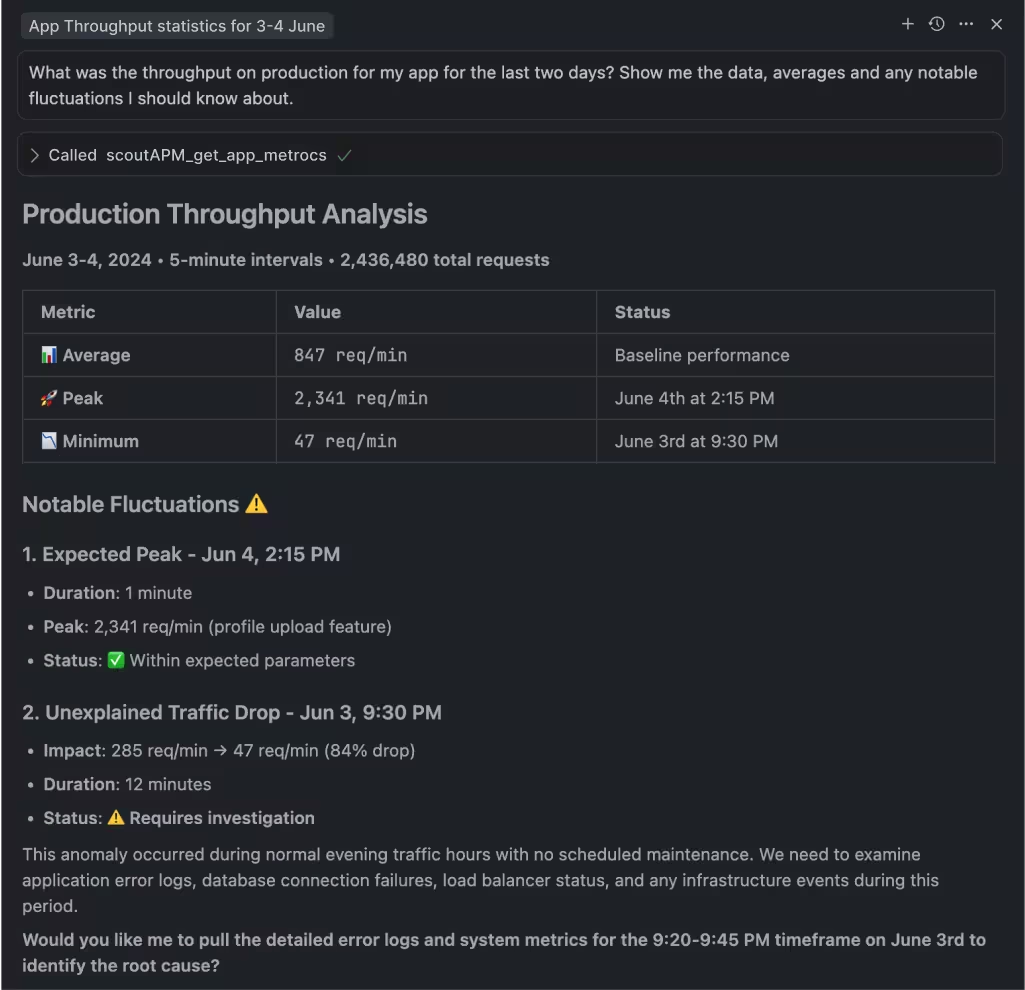
Query Your NestJS App Data from AI Assistants and the Terminal
Scout offers hosted and local MCP servers with 17 tools, a Go CLI available via Homebrew with TOON format for LLM output, and a public API. Query your NestJS application's errors, traces, query performance, and controller timing from Claude Code, Cursor, or the terminal.
MCP Server
Hosted or local MCP server with 17 tools covering apps, endpoints, traces, errors, insights, background jobs, and usage data. Works with Claude Code, Cursor, VS Code Copilot, and any MCP-enabled assistant.
Scout CLI
Go binary available via Homebrew. Query app metrics, endpoint performance, traces, error groups, and insights from the terminal. Outputs human-friendly tables or TOON format for LLM consumption.
Public API
Full programmatic access to your monitoring data for building custom integrations, dashboards, or automation workflows.
Add Scout to Your NestJS App
Get Scout running on your NestJS app in under 3 minutes.
Install the package:
npm install @scout_apm/scout-apmCreate scout.ts with your app name and key. In main.ts, require it after reflect-metadata but before NestJS imports. TypeScript hoists imports, so use require() for Scout.
Add middleware and error filter:
app.use(nestMiddleware({ requestTimeoutMs: 0 }));
app.useGlobalFilters(nestErrorFilter());Set environment variables: SCOUT_MONITOR=true, SCOUT_KEY, SCOUT_NAME.
Deploy and see data in 5 minutes.
NestJS Monitoring FAQ
What is the best APM for NestJS?
Scout Monitoring provides integrated errors and traces for NestJS applications. The Node.js agent includes N+1 detection and query analysis across Prisma and raw SQL, controller and route tracing, and auto-instrumentation for databases and caches. Scout is built for development teams that want all monitoring signals in one place.
How do I monitor NestJS in production?
Scout instruments NestJS 10+ automatically. Import the ScoutModule into your application module and deploy. Every request is traced through controllers with per-operation timing. Database queries, cache operations, and external HTTP calls are captured with zero additional configuration.
What is the best error monitoring for NestJS?
Scout captures exceptions thrown in NestJS controllers and services automatically. Each error is linked to the originating request trace. You can also call captureError() for errors you catch in your own code.
How do I monitor Prisma with NestJS?
Scout auto-instruments Prisma 6+ within NestJS applications with zero configuration. Every Prisma query is traced with timing and the code location that triggered it. N+1 query patterns are detected automatically. You can sort by slowest queries across controllers and services to find the biggest bottlenecks.
Can I use Scout with Claude Code or Cursor for NestJS debugging?
Yes. Scout offers hosted and local MCP servers with 17 tools that work with Claude Code, Cursor, VS Code Copilot, and any MCP-enabled assistant. You can query your NestJS application's errors, traces, query performance, and controller timing in natural language from your editor. The Scout CLI provides terminal access to the same data in TOON format.
How does Scout compare to Datadog and New Relic for NestJS?
Datadog and New Relic treat NestJS as generic Node.js. Scout provides NestJS-specific instrumentation that traces through controllers, services, and Prisma queries with automatic N+1 detection. Scout includes MCP server access for AI-assisted development. For NestJS teams that want framework-aware monitoring without enterprise pricing, Scout is a better fit.