
Congratulations! Your Rails app has finally started seeing consistent traffic and things are on the upswing. But with growth comes the potential for the sluggish sort of SQL queries that can really slow things down. In this post, we’ll go over what your database (whether it’s MySQL or PostgreSQL) can tell you about the problem, and we’ll also talk about what it can’t tell you. Spoiler alert: this is where Scout comes galloping over the hillside to the rescue!
What about ActiveRecord?
ActiveRecord has had some consistent improvements over the years, both in terms of performance and in terms of developer happiness. It can make querying feel clean and Ruby-like – but unfortunately, it can also produce some pretty inefficient SQL if used carelessly.
For instance, N+1 queries, full table scans, loading 10,000 records into memory when you only needed five. These are all common ActiveRecord anti-patterns that look innocent but create hidden performance landmines.
But no matter what has caused slowness to rear its ugly slowness, let’s focus on how to solve it. ActiveRecord is still generating SQL under the hood, so let’s go to the source.
What can MySQL and PostgreSQL tell us about our slow queries?
Really, the info that our databases can give us about sluggish performance isn’t super helpful if we want more insights on effectively solving the problem. This info isn’t highly actionable either. While you can easily determine the SQL statement that was executed and how long it took, these raw data streams leave open some painful questions:
- Where in the app is the slow query originating? (The specific line of code.)
- Is it an issue of constant slowness, or just “some-of-the-time” slowness?
- Which controller action or background job triggered the query?
Getting answers from the slow query logs requires a lot of elbow grease to aggregate the times, correlate the queries with ActiveRecord code, and to correlate the frequency in the slow query log against total executions based on endpoint throughput… it’s a tedious, incomplete and error-prone process (especially true for production systems under load).
OK, this is the part where Scout comes galloping in
Let’s cut to the chase here: all the things we just mentioned that your database can’t do for you – Scout can do. And it’s dead simple to get it up and running with your Rails app. With Scout, queries are analyzed across three primary dimensions:
- Which queries occupy your database the most? This is based on the total time consumed of each query, where time consumed is the average query latency multiplied by the query throughput. A 10-millisecond query that executes 10,000 times a minute is taking 100 seconds of database time, while a 50ms query that runs 10 times is still only 500ms.
- Which queries are significant bottlenecks inside individual web endpoints and background jobs? A single query that is responsible for a large percentage of the time spent in a given transaction is a great place to investigate for a performance win.
- Which queries are consistently slow? These are queries that have a high average latency. A sudden increase in these can starve your database of resources to process other queries, leading to system-wide impact.
Armed with this info, you can choose your adventure, for instance:
- Is cutting that 10ms query in half with a covering index (also supported by mysql ) going to ease the most db strain? Nice.
- Is fixing that single query during checkout that takes 80% of request time going to make your end users happiest? Maybe you can get creative with caching. Go for it.
Now that you know where time is being spent in the database as a whole and within individual requests, you can get straight to the code and make the changes. Here’s how.
Solving slow queries in practice with Scout
So, once the scout_apm gem is installed (and the database monitoring addon is enabled, if using our Heroku add-on) Scout continually analyzes your SQL queries… and slow queries are bubbled up as insights on your app dashboard:
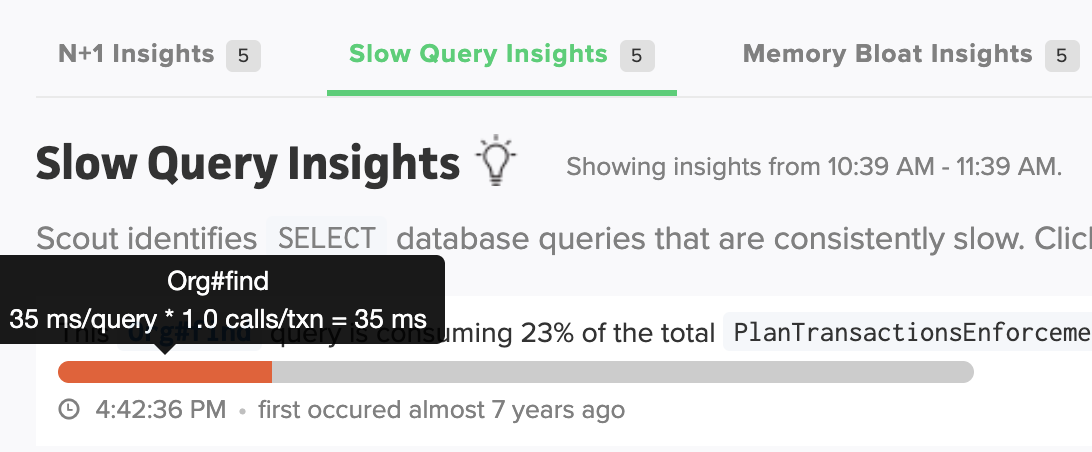
Then, when you click on a slow query insight, you’ll see that query’s call time information in the context of the calling controller-action:
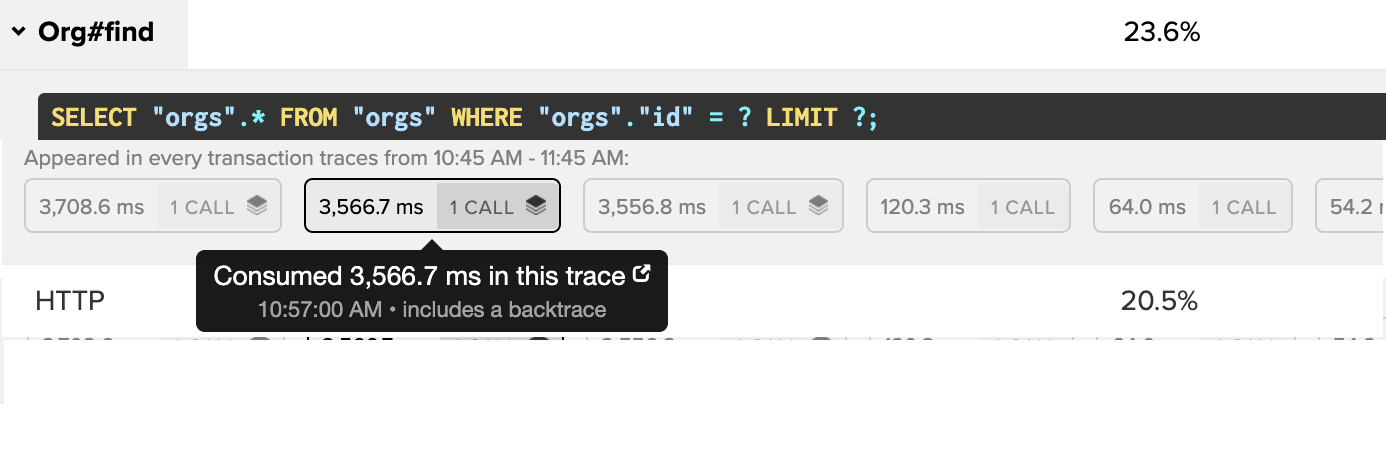
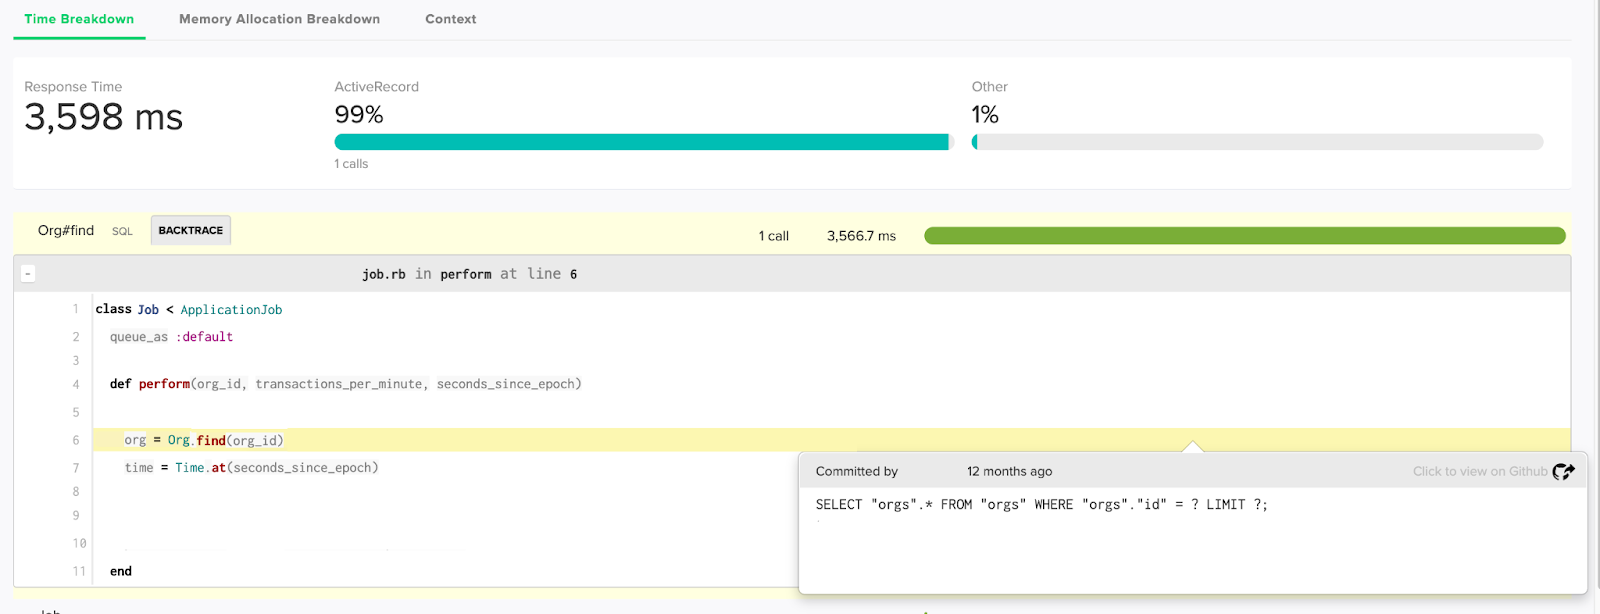
From there, you can view individual transaction traces where the query occurred and the source code location that is responsible for the query:
Every production Rails app has slow queries, but knowing which are most worth your time to optimize is the challenge. Scout gives you a huge boost by analyzing the impact of every query you run and putting them in the context of the requests your app is serving. If you need to prioritize your efforts and track queries down to the source line and Git commit where they’ve manifested – Scout is ready for you.
TL;DR
- More users, more chances for slow SQL queries.
- If used improperly, ActiveRecord can also spin up some problematic SQL.
- Slow queries are hard to track down and will ruin your day.
- The raw streams from MySQL and PostgreSQL aren’t sufficient.
- Scout is the way.