
Regular monitoring practices can emphasize application response time, but queue time is also often an early and important warning sign. If it rises, you’ll quickly see downstream effects: tail latency, timeouts, and error spikes. This means that this metric can give you a head start tackling app issues before they become user problems. In this post, we’ll discuss queue time, how things can go off track, and practical steps to turn it around.
Understanding the Queue Time metric
Let’s say you have 10 workers and 10 requests. In this case, you can process them all concurrently. But if the 11th (and so on) request hits and those first 10 aren’t finished processing, queue time grows and your app’s users can feel the slowdown.
In other words, queue time represents how long a request waits before your application even begins processing it. Meanwhile, application response time is the total amount of time your app spends actively processing a request after it’s been handed off to your code.
Little’s Law
Before we go further, let’s briefly note something: when we talk about queue time in web apps, we’re actually talking about a practical, real-world consequence of a classic formula from queueing theory: Little’s Law, which is as follows: L = λ × W.
- L is the number of active transactions in the system
- λ is the arrival rate ( throughput , or the number of requests your system handles in a unit of time)
- W is the average time spent in the system (average response time)
The relations between these variables elegantly describe traffic changes. If the arrival rate (λ) increases, then L (active transactions) must increase. When W (response time) increases, L must go up, too.
This law is useful to mention because it gives us a simple model for understanding the mechanisms behind queue time increases. When traffic increases or requests slow down, your system fills up, workers run out, and queue time naturally rises. It’s just that simple.
What causes long Queue Times?
How can queue time start to balloon? If any of the scenarios below are left unchecked, the problem can rapidly transform into a system-wide slowdown.
Scenario one: one slow endpoint starts to take down the whole system. Imagine a reporting or export endpoint (for example, generating a user report or downloading invoices as a PDF/CSV) normally takes 200ms. Then, it suddenly takes 5 seconds because of an unindexed query or a spike in data size. Slow requests like these hold onto workers far longer than usual, reducing your effective concurrency.
Even if the rate of traffic hasn’t increased, W (response time) goes up, which means L (active requests) increase, and the overflow ends up waiting in a queue.
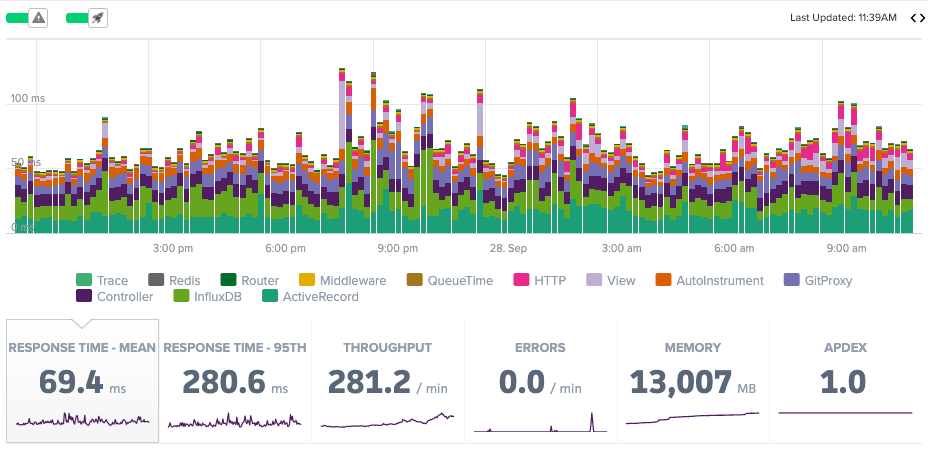
The app enters a dangerous pattern: a single slow endpoint quietly consumes workers, queue time rises, then this backlog spreads across the system. Tail latency increases, throughput dips, and error rates climb as requests time out. While the mean response time may stay deceptively normal for a while, the 95 percentile and queue time metrics will start flashing.
Scenario two: a burst of traffic briefly overwhelms capacity. A marketing email lands or a popular SPA page suddenly makes 30 requests instead of 5. Essentially, the arrival rate (λ) jumps faster than your workers become free or your app can scale. Once the active items exceed your worker capacity, queue time spikes instantly.
Scenario three: database connection pool exhaustion. Some of the most confusing queueing problems don’t have their root causes in your app servers at all but start in the database. For instance, when a worker tries to process a request but all DB connections are in use, that worker is effectively stalled.
How to proactively recognize and promptly respond to queue time chaos
To handle queue time issues in advance, it’s essential to monitor the right signals and correlate them correctly. Let’s use the scenarios above as a jumping off point to outline three monitoring practices that will work for this.
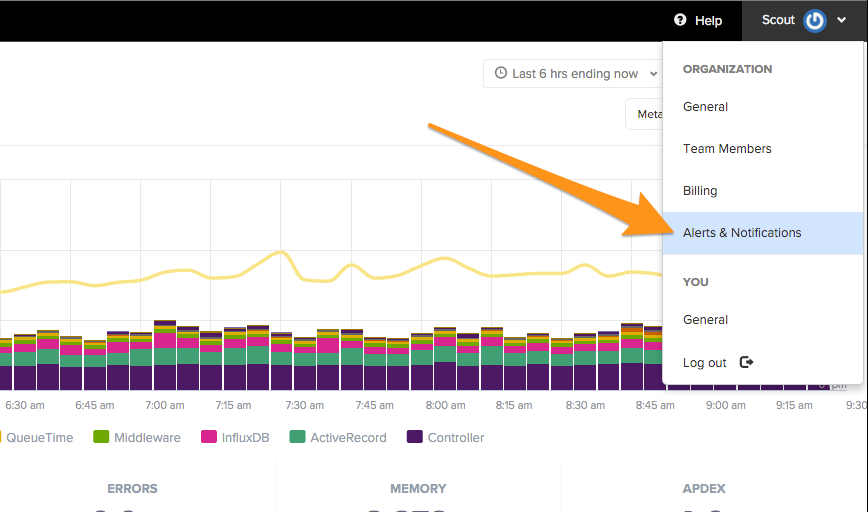
#1: Monitor slow endpoints and their impact on worker saturation. Rather than just looking at average response time, a focus on tail latency (95th percentile), per-endpoint performance and worker saturation signals is your first-line defense for preventing problems from cropping up. One thing to do is treat queue time as a first-class metric. Scout Monitoring actually allows alerting options for queue time increases.
Early-warning signals here give you time to act. If an endpoint suddenly jumps from 200 ms to 5 s, the 95th percentile and queue time metrics will flare long before the mean catches up. If you’re watching those, you can fix the slow query, add caching, or increase concurrency before the slowdown spreads across the entire system.
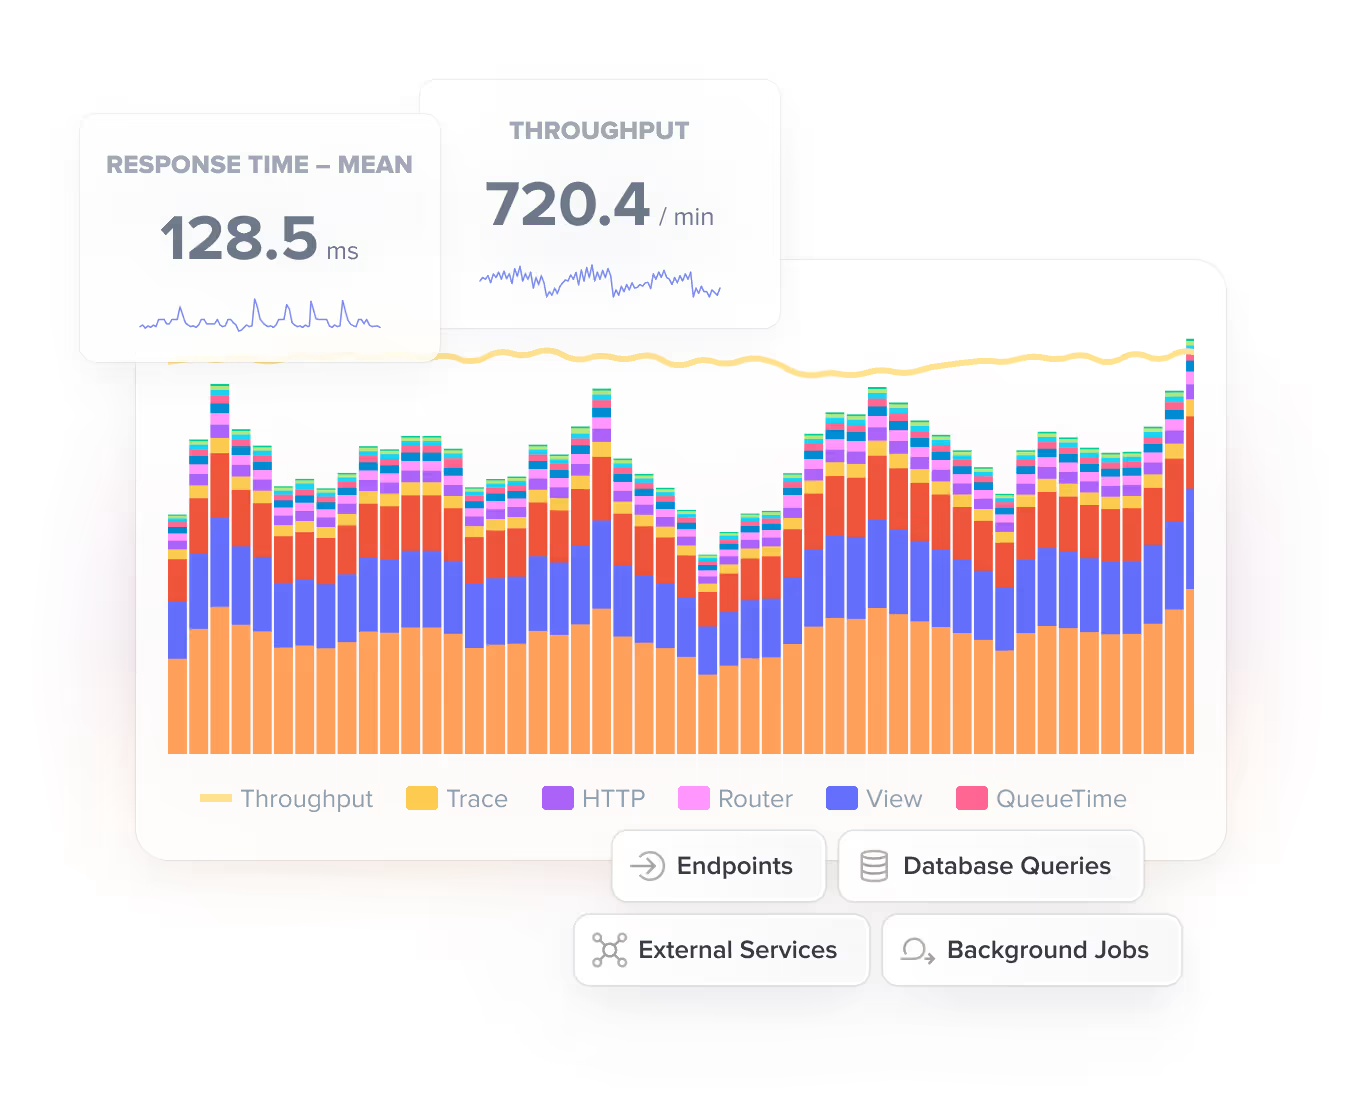
#2: Take care to manage and monitor traffic bursts and throughput spikes. are one of the fastest and most common ways for queue time to explode, especially if your application’s autoscaling can’t react quickly enough. When a new feature launches the arrival rate (λ) jumps far faster than workers can free up. Good monitoring here means watching throughput, queue time, and autoscaling behavior together.
Traffic surges follow a recognizable pattern: throughput spikes first, queue time rises next, and the 95th percentile time only goes up after workers have been saturated for a few minutes. If you alert on queue time the moment it diverges from normal levels, you get a critical early window to add capacity, mitigate bad frontend behavior, or throttle the costly endpoints before the surge turns into an outage.
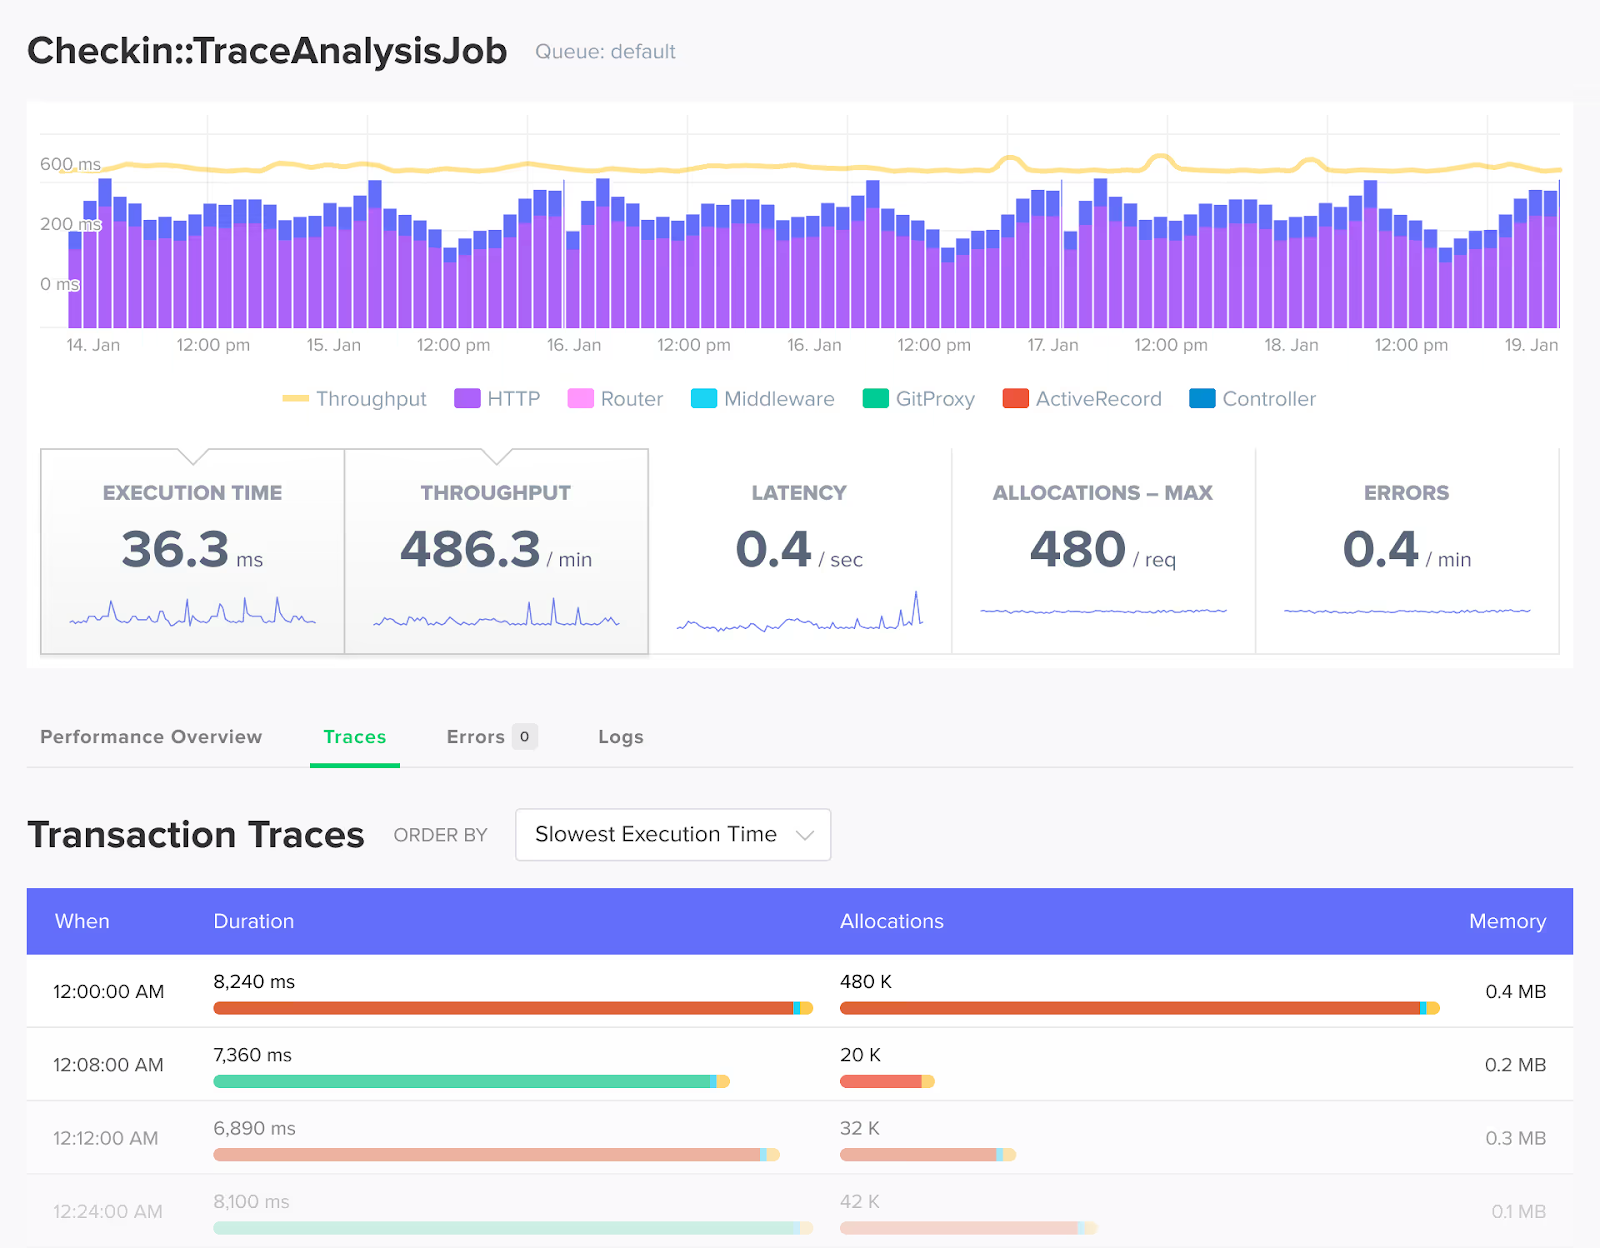
#3: Monitoring needs to treat database health as a first-class signal.When a worker is stuck waiting for an available DB connection, it looks “busy” from the outside, but it’s actually just blocked. Slow queries, missing indexes, or overloaded DB servers all increase the time each request spends in the system, and that creates backpressure: workers stall, requests pile up behind them, and queue time rises even though incoming traffic hasn’t changed.
Catching DB saturation early means you can tune connection pools, add indexes, or optimize queries before they cause a full-application slowdown.
Scout Monitoring makes all of this dead simple
The biggest challenge with queue time is actually understanding why it’s rising and spotting the warning signs early. Scout makes this dramatically easier because it surfaces the signals that correlate with queue time spikes and ties them together in a way that makes the diagnosis and solution easy.
(By the way, Scout also offers its own MCP server, so that’s an even more natural way to get insights like this.)
If you want to stay ahead of these queue time bottlenecks, Scout makes that process far simpler. And if you want to try this visibility in your own app, it only takes a few minutes to get started with the free 14-day trial!