
The error monitoring scene has changed a ton over the past few years. We’ve gone from basic exception tracking to fully integrated platforms that correlate errors with performance metrics and logs. We’ve even got AI-powered debugging! But in the midst of the AI explosion, some things remain unchanged and most teams are still drowning in data with little actionability.
Enterprise platforms like Datadog and New Relic have expanded into everything you can imagine: infrastructure monitoring, APM, logs, security, real user monitoring, synthetic testing, and so on. Meanwhile, Sentry has built an impressive error-focused platform with session replay and performance tracing.
Feature lists keep growing, dashboards keep multiplying, but small to mid-sized teams are telling us the same thing: “We have a lot of data. We just don’t know what it means or what to do about it.” You already have a lot of visibility, so Scout is focused on giving you more answers.
So, when it came time to integrate error monitoring, we decided to treat errors as first-class citizens alongside performance. This means that the integration depth and actionability is different than other tools: in Scout, errors and traces live in the same view by design, not as bolt-on features.
Error Monitoring in Scout
Error monitoring is now fully integrated with APM with errors, traces, and logs in one interface. When an error spikes, you can immediately see if it correlates with a performance regression, drill into the trace, and find the problematic code without switching tools or piecing together data from multiple sources.
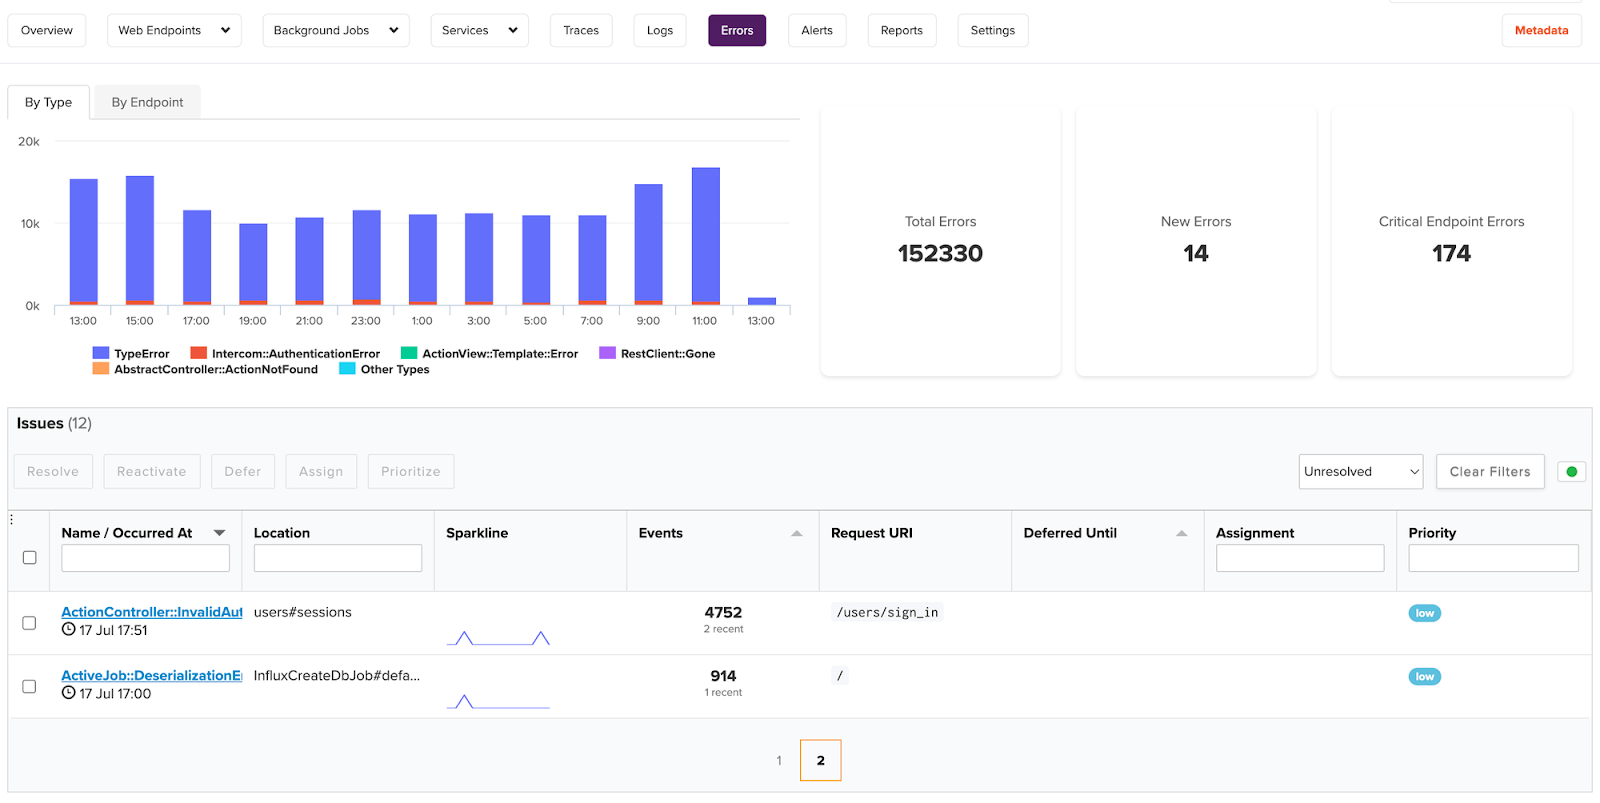
Key features include intelligent error grouping with automatic context capture, critical endpoint tagging for automatic prioritization, team collaboration with assignment and triage workflows, GitHub integration for code-level visibility, and 30-day retention of full error data.
The Benefits of Scout Error Monitoring in Detail
Modern error monitoring is about understanding and locating the real root cause. With Scout, you get full-stack traces with GitHub integration that take you directly to the line of code causing the issue. You see the request parameters and custom context that led to the error. This means you can correlate error spikes with performance degradation to understand the cause and effect.
The best error monitoring should integrate with APM data. When errors and performance live in the same interface, you can see the full picture:
- Did that spike in 500 errors happen because of a slow database query?
- Is the timeout causing the error, or is the error causing the timeout?
Without integration, you’re switching between tools trying to piece together a story.
When you’re dealing with hundreds or thousands of errors, you need intelligent grouping and prioritization. Good error-monitoring tools automatically group similar errors, flag critical endpoint failures as high priority, and let you bulk-assign issues to team members.
Smart alerting is about keeping your team informed while reducing noise. Instant notifications via Slack, email, PagerDuty, or webhooks enable your team to respond to new issues quickly (without notifications for every occurrence of a known issue you’re already working on).
Get Scout APM + Error Monitoring!
If you’re a Ruby, Python, Elixir, or PHP team that wants to spend time shipping features instead of configuring dashboards, if you want answers instead of data, Scout has been built for you.
Pricing is simple: a generous free tier gets you access to everything, including 5k errors. If you need more than that, you can get 50,000 additional errors for just $19. No per-seat charges, your whole team gets access. No surprise bills when traffic spikes.
(Scout also offers anMCP Server for teams using AI coding assistants. Your AI can query Scout directly to understand performance issues and generate fixes with full context.)