\
Docker's API provides a ton of functionality around containers and images - but there is a hidden secret, one that is easy to miss in the documentation: Docker's API has the capability to report host wide events! Container events like: die, restart & out of memory. With a simple GET request, these events are available for processing.
I'll take a look at how we can tap into this functionality, and how we can convert raw data into meaningful dashboards and alerts.
A Simple Spike
First, I'll take a look at Docker's monitoring events API. From the documentation, I have two options: polling or streaming. I'll use streaming with a GET /events command. A successful 200 response returns a JSON string indicating the status, id, from & time of the containers reporting events. Here's a sample:
{“status”: “create”, “id”: “dfdf82bd3881”,“from”: “ubuntu:latest”, “time”:1374067924}
Luckily for us, Swipely's team has already released a great docker-api gem. It's a lightweight Ruby interface into the Docker API. The gem has a section on event streams and appears to do everything I need it to do. Let's install this gem and try it out.
After doing a gem install docker-api, I'll jump into IRB on my Vagrant VM and issue some commands.
Looks like everything is configured correctly and I have a great starting point.
Now, I want to check for events.
What did I do here? First, I set the :read_timeout parameter to 100 minutes. That will give us time to test events vs. timing out (default is one minute). Next, I set up a simple block of code to execute whenever an event arrives.
In a new terminal tab - let's fire up a container:
docker run -it ubuntu date
…and in our original tab - we've got events!
Just to test again - let's start a longer running container:
docker run -it ubuntu /bin/bash
…and then in yet another terminal window, shut it down.
docker stop 3e2f58981df8
How can I take this further? How about a StatsD counter? A counter's job is to collect metrics over an interval and once that interval is complete - report the count of the metrics collected. After installing the statsd-ruby gem, I've whipped up a little script.
What's the script doing? It's basically the same thing as the IRB commands above, except line #11 is stripping out some extra information. The Docker API reports exec_create and exec_start events - but adds the command that was executed (e.g. /bin/bash). I want to know how many exec_create events were reported, but I don't need to know the counts of each specific command.
Bringing it home
Ok, I have to come clean. There's one issue with this script. The statsd gem is going to send the metrics, but how am I going to collect them? Well, I could use something like Graphite, but this post would be a LOT longer. I'm anxious to see these metrics so I'll use Scout instead.
I'll do a quick install on my VM:
curl -Sso scout_install.sh https://scoutapm.com/scout_install.sh
sudo /bin/bash ./scout_install.sh
Update my script to be executable:
chmod +x <SCRIPT_NAME>.rb
Run it, and fire off a few container events:
docker run -it ubuntu date
docker rm
.…then go check my Scout account. Docker events are showing up!
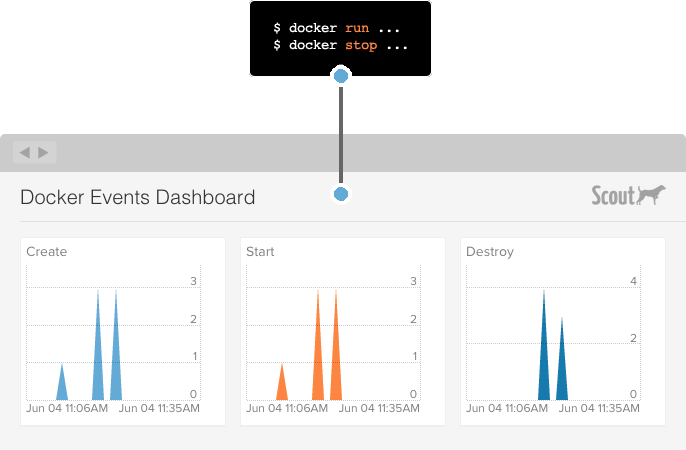
What else is cool? I can now add those metrics to my dashboards:
What else? I can create alerts on them. The next time any of my containers decide to puke and die, I can get an SMS message about their doomed state.
So what's next? I could run this script on every one of my containers - but that's not really the Docker way. Instead, Docker recommends that we should create our own container running this script.
Wait a minute… since I'm already running Scout and I see that they've already got a Docker image for it - I'll just update the existing Scout container with the new script.
Now, all I have to do is follow the directions for starting docker-scout on my host, and everything is set to go.
TL; DR
The Docker Events API gives us a lot of visibility into the workings of a Dockerized-host. With 17 lines of Ruby, StatsD, and Scout, we've got monitoring + alerting on those events.
Follow us on Twitter for more Docker and StatsD monitoring bits.
Also See
For application monitoring with errors, logs, and traces, Scout Monitoring provides the fastest insights without the bloat.