You do not have an SRE team. You are the SRE team.
Scout gives development teams of 2 to 20 people the monitoring they need without the complexity they do not. Errors, logs, and traces in one place. Set up in 5 minutes. No dedicated DevOps required.
Enterprise APM tools are not built for small teams
Datadog, New Relic, and Dynatrace were designed for organizations with dedicated platform engineering teams, SRE rotations, and DevOps budgets. They are powerful tools. They are also complex, expensive, and built for a team structure you do not have.
If your developers own the code, the deploys, and the on-call rotation, you need monitoring that respects that reality. Something that gives you answers fast without requiring a certification to use.
What small teams actually need

Everything in one place
Errors, logs, and traces in a single view. When something breaks, you see the error, the request trace, and the surrounding logs together. No switching between three tools to reconstruct one incident.

Set up in 5 minutes
Add the gem or package, set your API key, deploy. Scout auto-instruments your application with zero configuration. No YAML files to tune, no agents to babysit, no dashboards to build before you see data.

Problems found for you
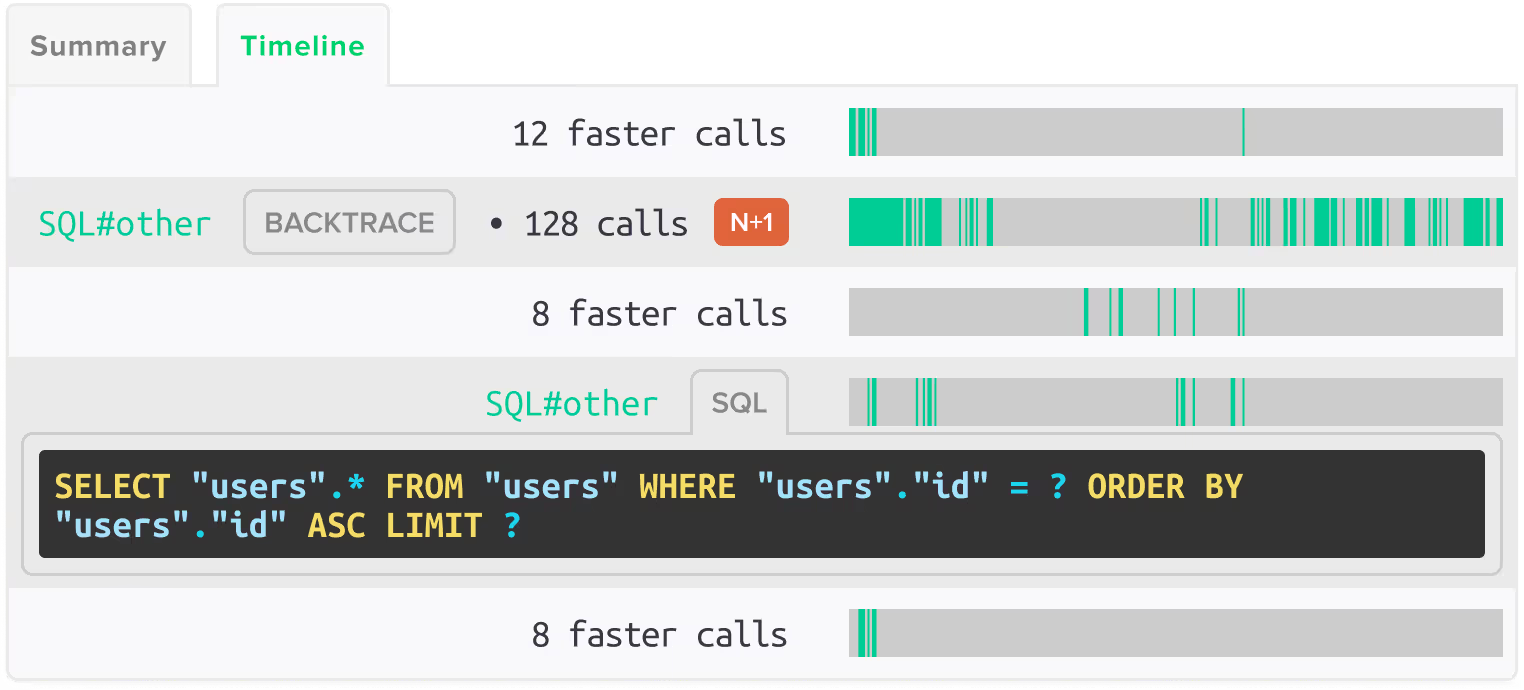
Scout automatically detects N+1 queries, memory bloat, and slow endpoints. You do not have to go hunting. The issues surface with the code location and performance impact so you know what to fix first.

AI-assisted debugging
Connect your AI coding assistant to Scout via MCP server and ask it about your production errors, traces, and performance data in natural language. Or use the Scout CLI to query everything from the terminal.

Pricing that makes sense
Transaction-based tiers with no seat licenses, no per-host fees, and no surprise bills when traffic spikes. Your monitoring cost does not grow faster than your business.

Ruby, Python, PHP, Elixir
Deep framework support for Rails, Django, Flask, FastAPI, Laravel, and Phoenix. Scout understands your ORM, your template engine, and your background job processor.
What teams like yours say
"Scout hit the sweet spot: real APM depth without the enterprise complexity or price tag. It covers a layer of our stack that nothing else touches for us."
"We don't have time to go through all kinds of configs or screens. Scout tells us: here are things that are important. And that is much easier for our small team to action."
"Scout has become an essential tool in our stack. It gives us instant visibility into where our Rails app spends time and resources, helping us detect and fix performance issues before they impact users."
- SOC 2 Type II certified
- No credit card required
- Month-to-month, cancel anytime
- Available on Heroku
- Available on AWS Marketplace
Scout vs the enterprise alternatives
Datadog felt like overkill
Datadog has 500+ integrations, infrastructure monitoring, security scanning, and network monitoring. If you just need to know why your Rails or Django app is slow, that is a lot of product to navigate. Scout gives you errors, logs, and traces for your application without the platform overhead.
New Relic gets expensive
New Relic charges per GB of data ingested plus per-user fees. As your team and traffic grow, the cost grows in ways that are hard to predict. Scout uses transaction-based tiers with unlimited users and applications included on every plan.
Sentry's APM is shallow
Sentry added performance monitoring, but it was built to support error analysis rather than stand on its own. You will not get automatic N+1 detection, memory bloat identification, or integrated log management. Scout's APM is deeply auto-instrumented for your framework's ORM, background jobs, and template rendering out of the box.
You want one tool, not three
Most small teams end up stitching together an APM, an error tracker, and a log aggregator. That is three vendors, three bills, and three sets of dashboards to check during an incident. Scout replaces that with one tool that shows you errors, logs, and traces together.
Get Started in Minutes
Add Scout to Your App
Install the agent, deploy, and see your first traces in about 5 minutes.
Get started in under 3 minutes with our Ruby agent.
- 1
Add the gem to your Gemfile:
gem 'scout_apm' - 2
Install it:
bundle install - 3
Download your customized config file and place it at
config/scout_apm.yml. - 4
Deploy.
Get started in under 3 minutes with our Python agent.
- 1
Install the package:
pip install scout-apm - 2
Add Scout to your framework: Django: add
"scout_apm.django"first inINSTALLED_APPS. Flask:ScoutApm(app). FastAPI:app.add_middleware(ScoutMiddleware). - 3
Set your Scout key and app name, then deploy.
Get started in under 3 minutes with our PHP agent.
- 1
Install the Laravel package:
composer require scoutapp/scout-apm-laravel - 2
Optionally install the PHP extension:
sudo pecl install scoutapm - 3
Set
SCOUT_MONITOR,SCOUT_KEY, andSCOUT_NAMEin.env, then deploy. Using Symfony? Installscoutapp/scout-apm-symfony-bundleinstead.
Get started in under 3 minutes with our Elixir agent.
- 1
Add the dependency to
mix.exs:{:scout_apm, "~> 2.0"} - 2
Download your customized config file to
config/scout_apm.exs. - 3
Add instrumentation in
lib/your_app_web.ex, then deploy.
Get started in under 3 minutes with our Node.js agent.
- 1
Install the package:
npm install @scout_apm/scout-apm - 2
Create
scout.jswith your app name and key, and require it first in your entry point. - 3
Add the middleware. Express:
expressMiddleware()anderrorMiddleware(). NestJS:nestMiddleware()andnestErrorFilter(). - 4
Set
SCOUT_KEYandSCOUT_NAME, then deploy.
Prefer one command? npx @scout_apm/wizard signs you up and configures everything.
 FAQ
Small Team Monitoring FAQ
What is the best APM for small development teams?
Scout Monitoring is built for development teams that do not have dedicated DevOps or SRE staff. It integrates errors, logs, and traces in one tool with automatic N+1 query detection, memory bloat detection, and 5-minute setup. Pricing uses transaction-based tiers with unlimited users and no seat licenses.
What is the best monitoring tool for startups?
Scout Monitoring offers a free tier with 300,000 monthly transactions, error monitoring, and log management included. Setup takes 5 minutes with no credit card required. As your application grows, you upgrade to higher transaction tiers without changing tools or losing data.
Do I need a dedicated DevOps team to use Scout?
No. Scout is designed for teams where developers own the application and the monitoring. It auto-instruments your code, detects performance problems automatically, and surfaces issues with the code location and impact so you can fix them without specialized tooling knowledge.
How does Scout compare to Datadog for small teams?
Datadog is a comprehensive observability platform designed for enterprise DevOps teams. Scout is focused on application monitoring for development teams. If you need errors, logs, and traces for your web application without infrastructure monitoring, security scanning, or 500+ integrations, Scout provides what you need at a fraction of the complexity and cost.
What languages does Scout support?
Scout supports Ruby (Rails, Sinatra, Grape), Python (Django, Flask, FastAPI), PHP (Laravel, Symfony), and Elixir (Phoenix, LiveView). Each agent provides deep framework-specific instrumentation including automatic N+1 query detection in ActiveRecord, Django ORM, Eloquent, and Ecto.