Migrating off Heroku? Don't let monitoring become another platform project.
Heroku Marketplace customer? Use code Direct26 for 10% off your direct Scout plan
Heroku made production feel simple. Whether your team is moving to AWS, DigitalOcean, Render, or anywhere else, you are taking on more infrastructure responsibility. Scout keeps app-performance monitoring simple enough for developers to own directly, without building an observability stack or waiting for an SRE team that does not exist.
Built for small teams running Rails, Django, Flask, Laravel, and Phoenix apps in production.
Download the Heroku Migration Checklist (PDF)
Heroku migration monitoring starts with a baseline
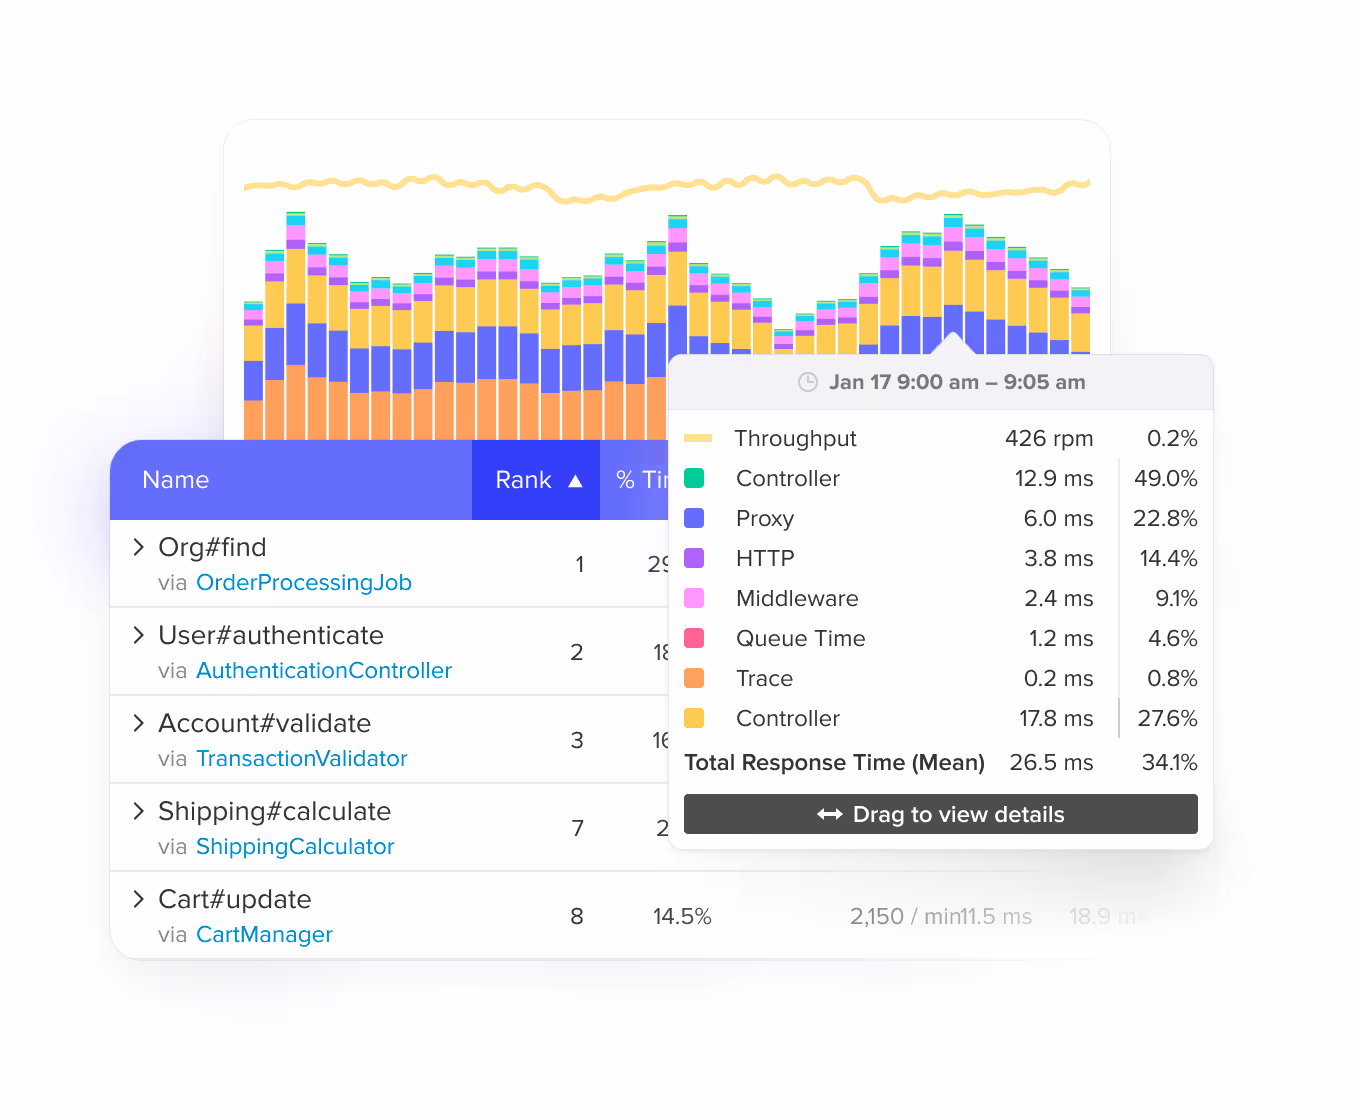
Know whether your new infrastructure actually improved performance or just moved the bottleneck somewhere new. Scout baselines your slowest endpoints, database queries, and background jobs so you can compare before and after. Deploy markers in the timeline show exactly when performance changed and which deploy caused it.
Code-level APM for teams leaving Heroku
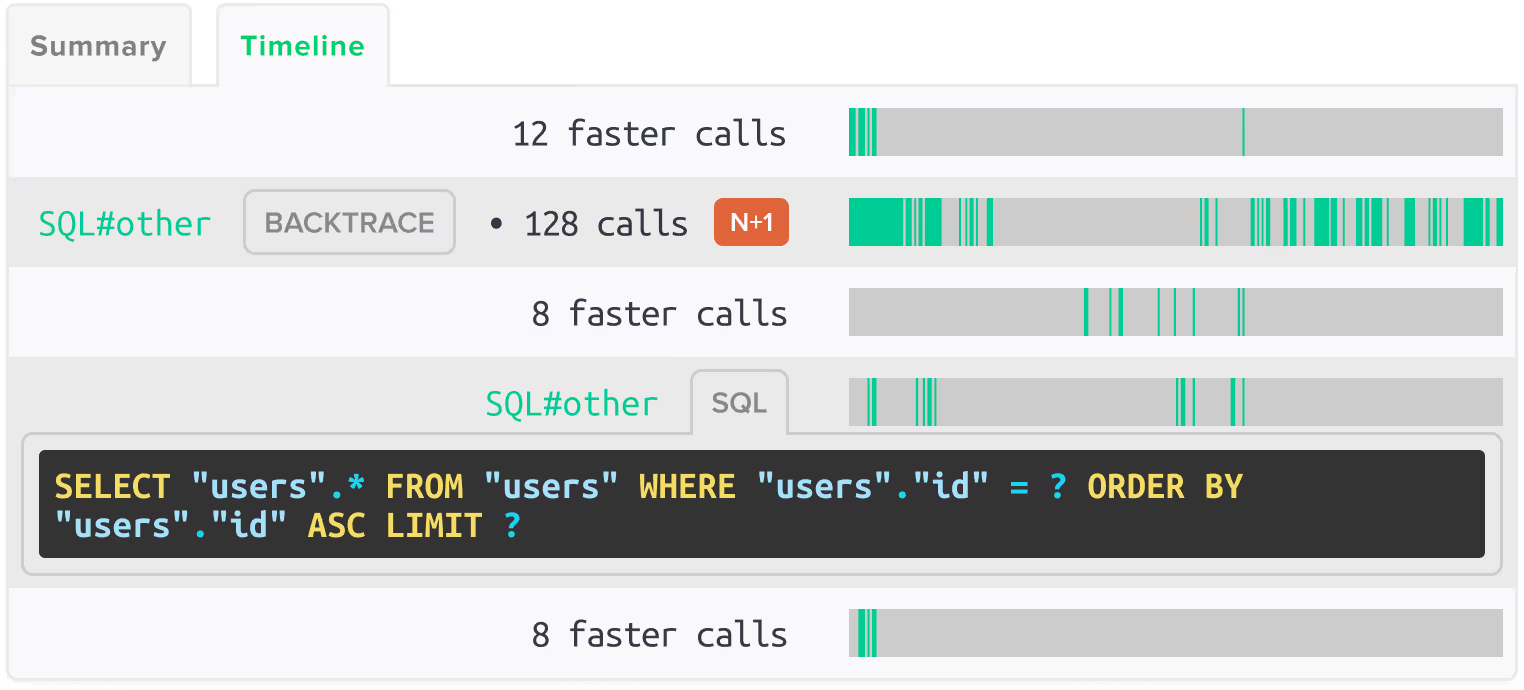
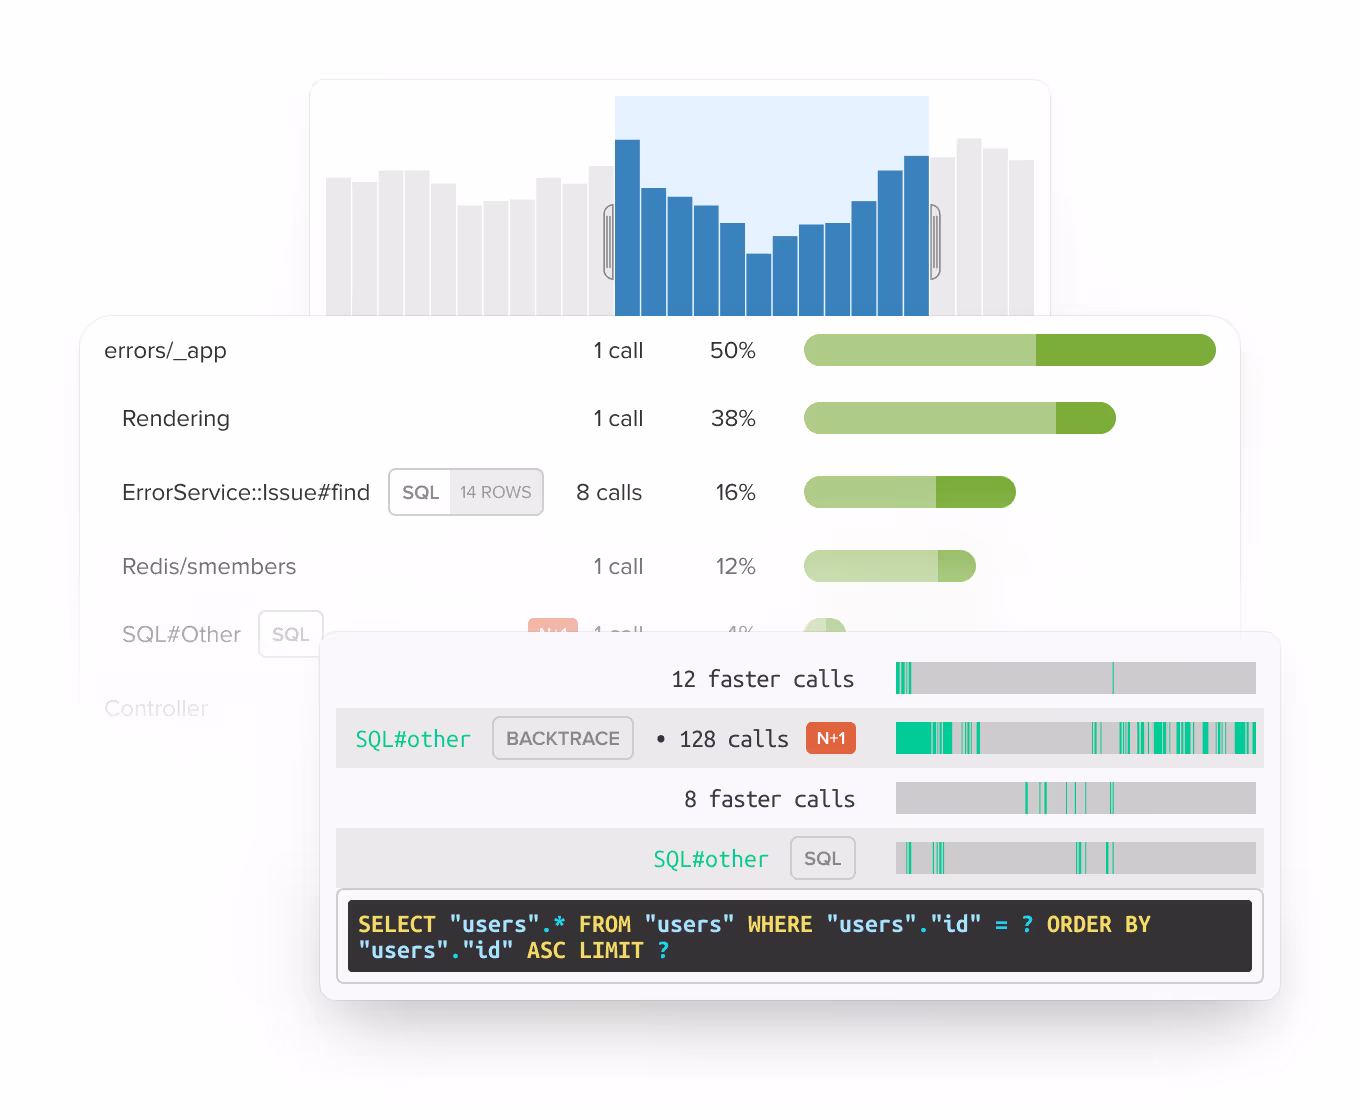
Dashboards are not enough when the real problem is an N+1 query, a slow endpoint, a background job, or a database call. Scout traces requests through your application code and shows where time is actually spent. Automatic N+1 detection in ActiveRecord, Eloquent, and Ecto finds the database problems that infrastructure monitoring usually misses.
Errors, logs, and traces in one view
When something breaks during migration, you need the error, the request trace, and the surrounding logs in the same place. Scout connects all three so you can see what happened before, during, and after an issue without switching between separate tools. Keep the debugging trail close to the performance problem.
Query your app performance from Claude Code, Cursor, or the terminal
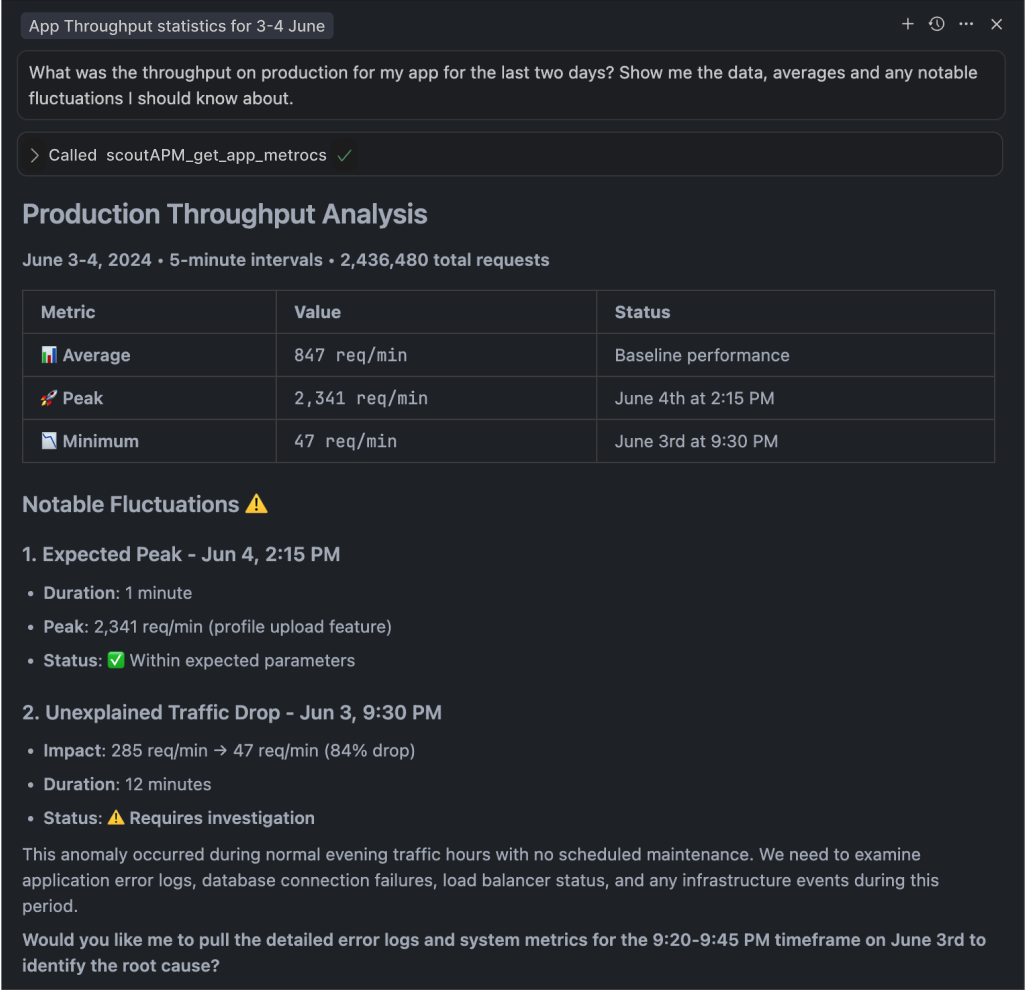
Scout's MCP server gives AI coding assistants direct access to your app's errors, traces, and N+1 insights during and after migration. Ask 'what got slower after the last deploy?' and get an answer with actual data. The Scout CLI is available via Homebrew and pipes production data into AI tools, scripts, and automation workflows.
Built for the team that gets paged before anyone says 'platform team'
Enterprise observability tools assume you have specialists tuning dashboards and managing alerts. Most Heroku migrations don't look like that. They look like a founder, a lead developer, or a small team trying to keep customers happy while moving infrastructure. Scout keeps monitoring useful at that scale.
Add Scout to Your Application
Get Scout running on your app in under 5 minutes, regardless of where you host it.
Add Scout to your project:
# Rails
gem 'scout_apm'

# Python / Django / Flask
pip install scout-apm

# PHP / Laravel
composer require scoutapp/scout-apm-laravel

# Elixir / Phoenix
{:scout_apm, "~> 2.0"}Sign up and download your config file. Drop it into your project.
Deploy. Data starts flowing in about 5 minutes.
Your Monitoring FAQ
Is Heroku going away?
No. Heroku remains actively supported and production-ready. The reason this page exists is that Heroku's product direction has changed, and some teams are evaluating whether other platforms give them more control for the next stage of their app.
Why do Heroku migrations need special monitoring attention?
Because the hosting layer is changing at the same time your team is trying to keep the app stable. Without a baseline, it is hard to know whether a slowdown came from the app, database, queue, network, deploy, or new infrastructure. Scout gives you that baseline and the code-level detail to diagnose what changed.
Where can I run Scout after leaving Heroku?
Anywhere your app runs. AWS, Render, Fly.io, Railway, DigitalOcean, bare metal, containers, VMs. Scout instruments your application code, not your infrastructure, so it works the same regardless of hosting provider.
Do we need a dedicated SRE team to use Scout?
No. Scout is designed for developers and small teams that need to diagnose production performance directly. If you can add a gem, pip package, or Composer dependency, you can use Scout.
What should we monitor before leaving Heroku?
Start with slow endpoints, database queries, N+1 risks, background jobs, error rates, deploy markers, queue latency, and the pages or API calls customers notice most. Scout captures all of these automatically.
Does Scout work with Rails apps?
Yes. Scout auto-instruments ActiveRecord, ActionController, ActionView, Sidekiq, Resque, DelayedJob, GoodJob, Solid Queue, Redis, and HTTP clients. No configuration needed. N+1 detection, memory bloat analysis, and deploy-aware performance tracking work out of the box.
Does Scout work with Python and Django apps?
Yes. Scout supports Django, Flask, FastAPI, Starlette, and Celery with request traces, database timing, error context, and production performance visibility.
Does Scout work with PHP and Laravel apps?
Yes. Scout supports Laravel and Symfony with automatic Eloquent N+1 detection, memory profiling, and queue worker visibility.
Does Scout work with Elixir and Phoenix apps?
Yes. Scout supports Phoenix, Ecto, LiveView, Oban, Finch, and Tesla with automatic instrumentation. Ecto N+1 detection and performance tracing work out of the box.
How much does Scout cost?
Plans start at the free tier (no cost). The cheapest paid plan is $19/month and includes 1 GB of log data, 5,000 errors, and a set number of transactions. No credit card required for the 14-day trial, and your account stays active on the free tier after it ends.
I had Scout through the Heroku Marketplace. How do I switch to a direct plan?
Sign up at scoutapm.com/users/sign_up and use the code Direct26 at sign-up for 10% off when moving from a Heroku Marketplace plan to a Scout direct plan. Your monitoring data carries over once you re-instrument with your new account key.