
You’ve built something, it’s live, and users are starting to show up. Maybe you programmed it from scratch, used a tool, or vibe-coded it into existence. No matter how it came to be, the fact that you’ve got users is great! But here’s a question every new developer must eventually ask: how do I know when my site is actually failing?
The thing is, these failures aren’t always obvious. A user might hit a broken form, an endpoint might slow to a crawl, or a feature could stop working entirely. All of this could happen without anyone on your team noticing.
If you’re only checking logs after someone complains, you’re already behind.
Don’t make the mistake of getting bogged down in logs
A common mistake is relying on manual log searches. The workflow usually looks like this: something breaks, a user reports a bug (if you’re lucky), and you scramble for your logs.
You scroll, filter, and grep, hoping to spot the red flag among a wall of timestamps and stack traces. Eventually, after a lot of search and a little guesswork, you piece together what happened.
The problem is that logs were never designed to be your first line of defense. They’re great for finding the root cause after you already know there’s a fire. But as your app grows, log files balloon in size and complexity, and even with log aggregation tools, you’re still spending time chasing errors that have already hurt your users.
Worse, this approach puts you at the mercy of your users: if no one reports the bug, you may not even know it exists until your churn rate or support queue spells out the story in bleaker terms than you’d like.
Good monitoring means catching errors before your users do
Proactive error monitoring flips that around. Instead of waiting until the damage is visible, you can use tools like Scout that will automatically track failures and alert you in real time: whether that’s by email, Slack, or another channel. The goal isn’t just to record what went wrong, it’s giving you the power to immediately fix the problem before users leave.
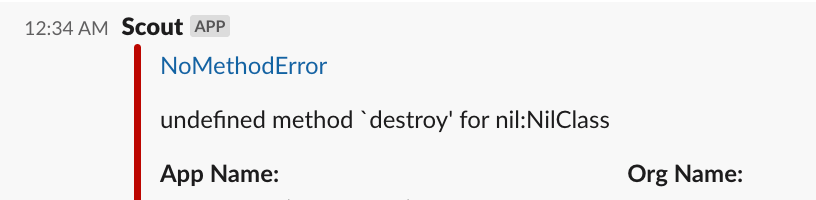
Skip the log search – get a Slack message when the issue happens, jump straight to all the context you need (like stack trace, affected user id) and send them an email telling them you resolved the issue before they’ve even opened a support ticket.
Scout makes collaboration straightforward by allowing error groups to be assigned to specific team members for clear ownership and accountability.
Notifications and alerting keep everyone informed: high-priority errors trigger immediate alerts, while deferred errors generate notifications when they become active again.
These notifications are sent to configured groups and channels, rather than based on individual assignments. Scout integrates with popular platforms to support flexible alerting, including Slack for instant team channel updates, email for traditional alerts, and many many more. Detailed configuration and setup instructions for each platform are available in the Alerting documentation.
The point is, the value of using a proactive monitoring tool in place of a reactive approach can be the difference between smooth sailing and disgruntled customers.
Seeing RED
Errors are a foundational element of application monitoring. Without them, all you have are support tickets and churn. There are two other app metrics that paint the picture of your app’s health: Rate (a.k.a throughput, requests per second) and Duration (time spent per request). With Rate, Errors and Duration (RED), you have at least the most basic idea of how your app is working. The sky is the limit from there (StatsD will happily count how many times people named Alice search for persimmons in your grocery app), but these will take you a long way.
For Ruby on Rails, Django, FastAPI and more, Scout will take care of all the instrumentation and dashboarding for you and let you spend time building the app instead of building the monitoring system.
Scout is Going Further for AI-First Teams
As AI-native development becomes the norm, Scout aims to provide the monitoring MCP (Model Context Protocol) server of choice for AI builders. That means error and performance data won’t just sit in charts, and you’ll be able to interact with it directly in your AI coding assistant. For instance: “Show me the latest five errors. Get details and a stack trace along with error context about the highest-frequency error. Write a failing unit test that exposes this error. Create a branch, commit a fix, push the branch to origin and open a pull request.”
For newer developers (especially those experimenting with AI tools, Copilot, or low-code frameworks) we believe this will be a game-changer.
So, instead of getting lost in logs, be confident your app is reliable, resilient, and that you catch any errors before your users by giving Scout a try now!